|
TUESDAY EDITION June 9th, 2026 |
|
Home :: Archives :: Contact |
|
|
Time (Again) For Crack Trades?By Brad Zigler www.hardassetsinvestor.com October 30th, 2009 Halloween's approaching, and with it comes the prospect of tricks and treats for oil market traders. For traders plying the "crack spread," one of the market's tricks actually turns out to be more of a treat. These ghoulish-sounding crack spreads ("crack" refers not to the crushing of bones but the busting of hydrocarbon molecules) simulate the economics of oil refining. For example, a refiner typically buys crude oil and processes it into products, such as gasoline and heating oil, for subsequent sale. Thus, a refiner's profits are highly dependent upon purchasing crude at a sufficient discount to the proceeds of the refined product. There are two main types of crack spreads to note. The so-called 2-1-1 crack, geared for either winter refining or the use of heavier grades of crude, yields one barrel each of gasoline and heating oil for every two barrels of input crude. Lighter, sweeter inputs such as West Texas Intermediate can supply incrementally more gasoline and may be cracked in a "3-2-1" ratio; that is, every three barrels of crude supply two barrels of gasoline and one barrel of heating oil. Spread Calculations The first step in determining the potential profit represented by a crack is rationalizing the spread's components. Crude oil is priced by the barrel, but gasoline and heating oil prices are denominated in gallons. Both futures contracts, however, call for the delivery of 1,000 barrels, albeit indirectly in the case of distillate futures. (Heating oil and gasoline contracts, priced in cents per gallon, require a 42,000-gallon delivery, but with each barrel holding 42 U.S. gallons, it's really just 1,000 barrels, like crude futures. To determine the gross crack spread implied by futures, a trader simply multiplies distillate prices by 42 to obtain their barrel equivalents.) Let's walk through an example. Suppose that nearby NYMEX crude futures are offered at $80.00 per barrel. That represents a refiner's input cost. The processing output is typically represented by gasoline and heating oil contracts deliverable in the month following crude delivery, as this better simulates the actual storage, refining and marketing timeline. So let's suppose gasoline a month forward of the crude delivery is bid at $2.00 a gallon, while heating oil's fetching $2.10. Converting the distillates to their barrel equivalents makes gasoline worth $84 a barrel ($2.00 a gallon x 42 gallons) and heating oil $88.20 a barrel ($2.10 a gallon x 42 gallons). The 3-2-1 crack spread can then be calculated using the simple arithmetic: 3-2-1 Crack Spread = [(2 x Gasoline) + (1 x Heating Oil)] - (3 x Crude Oil) or [(2 x $84.00) + (1 x $88.20)] - (3 x $80.00) = $16.20 per 3 barrels of crude, or $5.40 per barrel. The math for a 2-1-1 crack is similar: 2-1-1 Crack Spread = [(1 x Gasoline) + (1 x Heating Oil)] - (2 x Crude Oil) or [(1x $84.00) + (1x $88.20)] - (2 x $80.00) = $12.20 per 2 barrels of crude, or $6.10 per barrel. The 2-1-1 crack commands a premium over the 3-2-1 spread typically in the fall and winter, as the demand for heating oil increases. Fortunes reverse ahead of the summer driving season, when the gasoline-heavy 3-2-1 crack tends to outperform the 2-1-1 spread. Interpreting The Crack Spread Variances in the crack spread reflect the pricing of input crude relative to its output products. Generally speaking, there's a negative correlation between crude oil prices and the crack spread; meaning when oil prices increase, profit margins tend to contract. Also, in great part, crude oil tends to re-price more quickly than the products, so crack spreads tend to widen or narrow when crude oil prices move precipitously. For example, last year, when crude peaked at $145.29 just before Independence Day, the 3-2-1 crack spread stood at $13.12 a barrel. By the time oil bottomed at $33.98 in mid-February 2009, the spread had widened to $22.98. In broader terms, crack spreads also reflect the demand for refining capacity. Because there's a limit on refining capacity, when appetites for refined products spike, spreads are more likely to widen. Refiners can throttle operations up or down to meet demand (presently, refineries are operating at only 81 percent of capacity), but there's always a certain amount of capacity off-line for repair or switchover. If recent history is any guide, utilization maxes out at 94 percent. Additionally, there's a positive correlation between the crack spread and capacity utilization, reflecting refiners' ability to modulate their product availability. Refinery operators clearly have more maneuvering room on the downside to deal with slackening demand. For example, in September 2008, after the summer driving season ended, utilization dropped below 67 percent as refining margins thinned. Refinery capacity constraints will likely be felt even in a robust economic recovery, should demand for products overtax existing facilities. After all, it'll take a long time to put new refining capacity online. Refining Utilization And Crack Spreads 
Refiners regularly trade crack spreads in the futures market to hedge their operating margins against market volatility. Speculators, too, trade the spreads, enticed by the 75 percent margin credit granted by the NYMEX clearinghouse. Those anticipating an expansion in refiner profits—in other words, fatter cracks—typically sell crude oil futures and simultaneously purchase heating oil and gasoline contracts. "Buying the crack" in this fashion makes money, as crude oil costs lag increases in the prices of refined products. Conversely, shrinking refiner margins can be profitably exploited by "selling the crack"—buying crude while shorting gasoline and heating oil. Cracking The Current Market With ETFs When the economy faltered, crack spreads narrowed, so, it makes sense that they'd widen as we pull out of recession. Earlier this month, the 3-2-1 crack was scraping along at $4.45 a barrel, while its 2-1-1 analogue was $5.13. Just two weeks later, the spreads have built up to $7.40 and $7.94, respectively. Impressive as these gains are, the spreads are still well below their year-to-date medians—$10.80 for the 3-2-1 crack and $11.65 for the 2-1-1 spread. Keeping that in mind, there's likely to be more upside potential for traders buying the crack, even at these levels. Nowadays, however, traders can capture spread changes without resorting to the futures market. The introduction of crude oil, gasoline and heating oil exchange-traded funds allows investors to trade the spread margin free—at least the 2-1-1 version, anyway. Buying equal lots of the ProShares UltraShort DJ-UBS Crude Oil ETF (NYSE Arca: SCO), the United States Gasoline Fund (NYSE Arca: UGA) and the United States Heating Oil Fund (NYSE Arca: UHN) effectively puts an investor short two units of crude oil and long one unit each of gasoline and heating oil. In other words, this three-legged purchase simulates buying the crack. The ETF version of the spread makes life fairly simple for an investor. It can be transacted in a securities account; no futures account is needed. Even better, the spread can be held with relative impunity, even when refining margins aren't improving. For example, the returns earned from holding the ETF spread since the top of the year—not the most favorable of margin environments—would have been 3 percent. That's a 3 percent gain, mind you, which doesn't sound all that impressive until you compare it with the results of holding the futures analogue: A fully collateralized futures spread would have lost 14.6 percent. Factor in the leverage afforded by margin, and you're talking about a much larger potential loss. Part of this risk disparity is due to volatility, which is much smaller in the ETF version of the spread—less than a fifth of the volatility of the futures-based spread, in fact. There's a lot less maintenance required of the ETF spread as well. Contracts don't have to be rolled over, there's no contango or backwardation to deal with (not directly, that is) and investors don't have to worry about changes in margin requirements. 2-1-1 Crack Spread: Futures Vs. ETFs 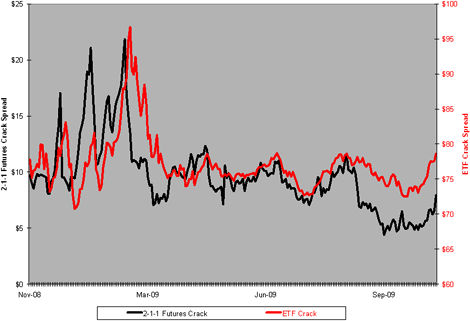
You can see that the ETF version tracks the 2-1-1 crack fairly well, although not exactly. The differential is due to a couple of factors. First of all, the ETF spread reflects the last sale data typically available to retail investors, while the futures spread is based upon settlement values, not last-sale data. Using end-of-day bids or fund NAVs would narrow the apparent difference significantly. Nor is contango reflected in the ETF spread. By design, the product ETFs are continuously invested in front-month futures, rather than the back-month contracts dictated by a refining simulation. Contango's generally shrinking now, but earlier this year, it was a significant source of dissonance. The economy may still have a few tricks up its sleeve this Halloween, but those traders eager to wager on recovery now have a trick of their own that just might turn the crack spread into a real treat. By Brad Zigler www.hardassetsinvestor.com October 30th, 2009 |
| Home :: Archives :: Contact |
TUESDAY EDITION June 9th, 2026 © 2026 321energy.com |
|