|
SATURDAY EDITION April 19th, 2025 |
|
Home :: Archives :: Contact |
 |
Oil To Become The Big Story Again McClellan Financial Publications, Inc. May 31st, 2005 excerpt from The McClellan Market Report #243
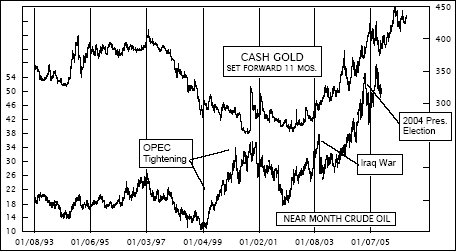 Since making a price top on March 21, crude oil prices have been correcting in a move lower. Such a move is the perfect act to restore complacency about low oil prices, the better to set up conditions for the next up wave. Our first chart shows the leading indication for crude oil prices which is given by the price history of gold.
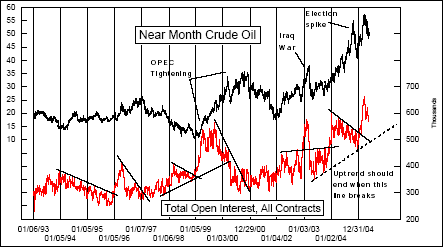 When oil prices are following strictly the interplay of the oil market’s supply/demand forces, then gold provides a great leading indication of what lies ahead. But it is important to realize that certain political events and agents (like OPEC) can sometimes put a thumb on the scale and skew the relationship. It is also important to realize that the 11 month lag period shown in this chart can expand or contract at times, so that chart structures may not always line up precisely. With those caveats in mind, this relationship is saying that the correction in oil prices ought to be over about now, and the next upward leg should be commencing. The downward correction has lasted a bit longer than gold’s schedule called for, but was just a case of oil being fashionably late as opposed to missing the party entirely. Now some oil inventory numbers have gotten things turned around, and the new rally appears to be under way. One technical tool which has recently been brought to our closer attention is the relationship between the total open interest on all futures contracts for a specific commodity or financial product, and the price behavior of that contract. Below we compare crude oil prices to the total open interest on all crude oil futures contracts. Generally speaking, there is a nice positive correlation, and it is only when that correlation breaks down that we start to get interesting information about a potential trend change. The higher highs of 2000, for example, were accompanied by declining open interest which suggested they were doomed to collapse. At other times, you can see that the breaking of trendlines on the open interest line have had important meaning for the oil price trend direction. It is our view that oil prices won’t end their uptrend until the dashed rising bottoms line is broken on the open interest line. That break is a long way off, and there are more important things to consider at the moment.
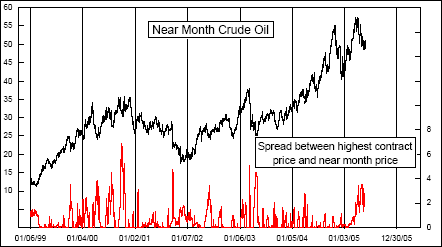 One such consideration is the “contango” present in crude oil futures. That‘s a fancy word meaning that the out month contracts are priced higher than the near month contract, as shown in the top chart on page 2. What is important to understand is that a contango like this is usually a sign that higher prices lie ahead, and that important price highs in crude oil tend to only be put in when this indicator has dropped to zero. That tells us that there are higher prices ahead for oil.
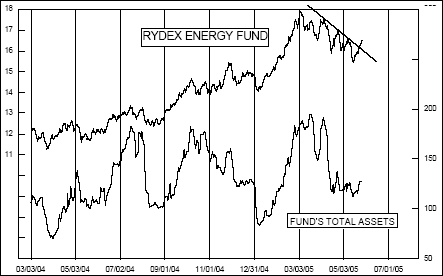 Sentiment appears to be in place for a nice bottom in oil stocks as well. The second chart on page 2 shows the total assets invested in the Rydex Energy Fund. This fund’s assets wax and wane along with oil prices, and over the past year have oscillated between $100 million and $200 million. Right now, it is closer to the lower end of that range, which is consistent with bottoming action in crude oil prices, and in the prices of the stocks which comprise this fund. Bottom Line: Oil prices are poised to move higher for the rest of this year, and they should take the share prices of oil companies’ stocks higher with them. Lots more follows for subscribers...
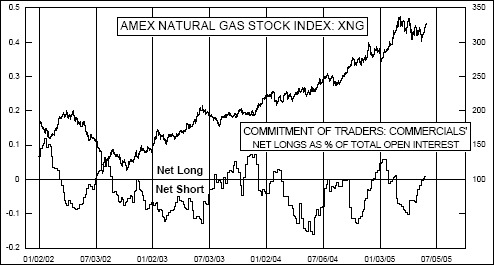
Bonus Excerptexcerpt from The McClellan Market Daily Report from May 27thAlso interesting in this week’s COT Report is the fact that commercial traders of natural gas futures have moved to a net long position. Our final chart shows the last 3+ years of history for this indicator, and the important point to take from this is that when commercial natural gas futures traders are net long, that tends to be a great time to be a buyer of the shares of natural gas companies as represented by the XNG. It is also worth noting that commercial crude oil futures traders have moved to the biggest net long position seen since the December 2004 low, and that an uptrend is likely to follow. We address other reasons to expect a rise in crude oil prices in the issue of our twice monthly McClellan Market Report newsletter which went out to subscribers today. It looks like the next few weeks or months should be a bullish period for the metals and energy sectors.
McClellan Financial Publications, Inc ©2005, McClellan Financial Publications, Inc., P.O. Box 39779, Lakewood, WA 98439-0779, www.mcoscillator.com, tel: 253 581-4889, 800 872-3737, fax: 253 584 8194.
This copyrighted periodical is published on stock market trading days by McClellan Financial Publications, Inc., and is intended solely for use by designated recipients. No reproduction, retransmission, or other use of the information or images is authorized. Legitimate news media may quote representative passages, in context and with full attribution, for the purpose of reporting on our opinions. Analysis is derived from data believed to be accurate, but such accuracy or completeness cannot be guaranteed. It should not be assumed that such analysis, past or future, will be profitable or will equal past performance or guarantee future performance or trends. All trading and investment decisions are the sole responsibility of the reader. Inclusion of information about managed accounts program positions and other information is not intended as any type of recommendation, nor solicitation. For more information, contact Global Investment Solutions at (800) 440-7283. We reserve the right to refuse service to anyone for any reason. The principals of McClellan Financial Publications, Inc. may have open positions in the markets covered. Subscription cost: $600/year, or $160/qtr qtr. Subscribers paying quarterly agree to accept automatic subscription renewal by credit card.
We also publish the twice monthly McClellan Market Report newsletter, which is available by separate subscription at $195/year. |
| Home :: Archives :: Contact |
SATURDAY EDITION April 19th, 2025 © 2025 321energy.com |
|