|
FRIDAY EDITION March 27th, 2026 |
|
Home :: Archives :: Contact |
|
|
Oil Market Update - current stalemate may end in a surprising manner...Clive Maund October 20th, 2020 The oil price has made a remarkable recovery from its extreme April panic lows, given that demand has been dramatically slashed by the economic damage and severe travel restrictions caused by the disproportionate response to the engineered virus scamdemic and has only partially recovered, and after its initial sharp bounce back from the lows it has plateaued at a relatively high level since June. The reasons for this are that the Military – Industrial complex and the financial sector need a buoyant oil price, so the price has been maintained at an artificially high level due to a combination of complex financial engineering and creating vast quantities of fiat to use to prop it up, and as we will see the charts are suggesting that this will probably not end anytime soon. The 1st virus wave back in the Spring collapsed demand for oil due to most people not travelling anywhere, either by car or plane, and now with the 2nd wave starting, exactly as predicted in Welcome to the Global Gulag posted back in August, the question arises as to whether it will cause the oil price to plunge again. The reason that it was possible to accurately predict this development months in advance is that I know what the objectives of the architects of this plot are. There are 2 main reasons for imposing the lockdowns. The first it to destroy small businesses and reduce the middle class to a state of dependency. This enables the larger corporations, who are the beneficiaries of stimulus (paid for later by the population at large who will fall victim to hyperinflation), to buy up the assets of the former independent business community for pennies on the dollar, be they commercial premises, plant and equipment or the workforce in what amounts to a massive wealth transfer. The 2nd main reason is to create an atmosphere of fear, desperation and paranoia amongst the great mass of the population, such that they will accept any route that is offered them to return to a normal life, such as submitting to being vaccinated. What they sadly don’t understand is that being vaccinated will not be a ticket back to normality – they are being lured into a trap. It is also vital to realize that this 2nd wave of lockdowns is going to be – and is intended to be – much more brutal and long lasting than the 1st one, in order to break down the population and force them into total submission. Don’t be fooled by the bogus stats about “cases” being pumped out all over the world now. They are all the product of statistical fraud as made clear by John Rappoport in his excellent series of essays on the subject posted over the last week or so. One obvious way in which this fraud operates is that, all of a sudden, nobody is catching the flu anymore, because all flu cases are labeled Covid to ramp the stats. Even if all the cases were real Covid cases, which they are not, why would you be worried enough about it to hide out at home, given that it kills less than 1% of its victims?? Remember the blood curdling projections that were everywhere back in the Spring? – fool me once, fool me twice – I don’t think so… The key question for us with respect to the oil price is whether or not this 2nd lockdown phase will smash the oil price down in a similar manner to the 1st phase. At first sight the seemingly logical conclusion is that it will, but there are a couple of reasons why it may not. The first is that, as we have already observed, the oil price is being maintained at a relatively high level by sophisticated financial engineering, and we can expect that to continue. WE NO LONGER HAVE FREE MARKETS – the most obvious example of this being that the stockmarket is not far off all-time- highs at a time when the economy is imploding – the stockmarket should already have lost more than half of its value and the reasons that it hasn’t is that the Fed and other Central Banks have been creating trillions of dollars out of thin air to prop them up and buy the distressed assets of failing smaller businesses. The implication of this is that, since they are above the law, or more accurately they ARE the law, they can create however many trillions they like to throw at propping up the banks, the oil sector or anything they like, with the tab being passed to the ordinary citizen later as their money loses its purchasing power. This is why, even if the demand for oil collapses, the price of it won’t necessarily collapse and as we will now proceed to see, the oil charts are actually suggesting that the sector could ascend from here, lockdowns or not. It is perhaps best if we start by looking at the 1-year chart for Light Crude, because on this chart we can see the lead in to the Spring collapse as the virus scamdemic hit, and the remarkable recovery that followed – remarkable because demand did not recover much. Normally, we would take the recovery from the April low to be a classic bearmarket rally that should be followed by another severe, if slower, downtrend, but the complicating factor here of course, as mentioned above, is massive intervention by a Fed that now feels emboldened to create money in limitless quantities. This is what may head off any decline and even get the price moving higher still in tandem with other assets as a tidal wave of inflation hits. We will always keep in mind however that a dollar crash – which is going to happen one day – will put an end to this game by causing interest rates to spike uncontrollably. This is why we will keep a close eye on the key support level shown, because if that fails, regardless of any abstruse arguments, oil could crater again. That said there are various factors pointing to it starting to ascend from here. One is that the price broke above the Distribution Dome that we had drawn on earlier charts, by virtue of moving sideways, and this Dome is not shown here because it is no longer relevant. Another is that the Accumulation line is advancing to make new highs, which, while it cannot always be trusted it at least a promising sign. Finally, a few weeks ago, we saw a bullish cross of the moving averages which increases the chances of oil breaking above the resistance level at recent highs. 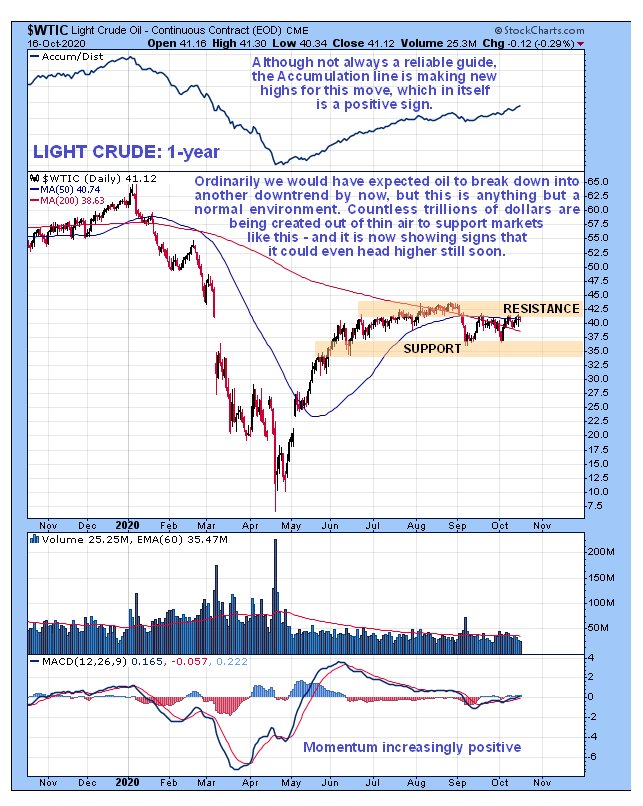 While the 1-year chart for Light Crude tells us most of what we need to know, it is worth taking a look at a couple of other charts too, and by way of a change we’ll now look at the 6-month chart for Brent. As we can see it is telling a very similar story to the West Texas Light Crude chart, but being 6-month we can see again, this time more clearly, the strong Accumulation line, the bullish cross of the moving averages this time in October and in addition the sizeable white candles on the last two minor rallies which also look positive, with momentum (MACD) also improving in recent weeks. Again, the support shown must hold – if it fails we could see a severe decline. 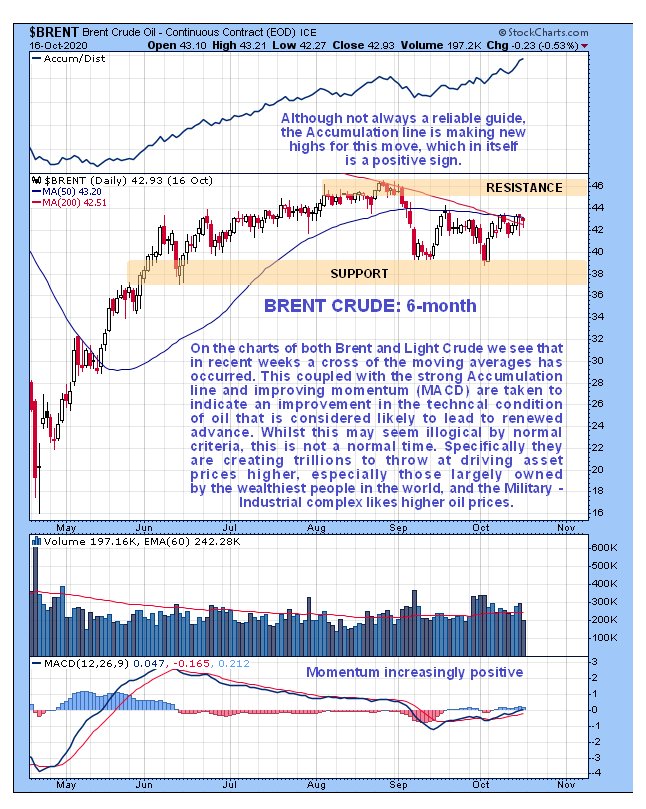 The 10-year chart for Light Crude gives us a broader perspective, and in particular we can see why the oil price has been capped for months around the current, which is because it has arrived at the zone of strong resistance shown arising from trading just above these price levels dating back to early 2015. What this chart definitely does not show of course is the Fed going off the scale with its colossal money creation this year, which has baked in hyperinflation and an explosion of asset prices until the dollar implodes and interest rates spike, which is still though to be some way ahead of us. 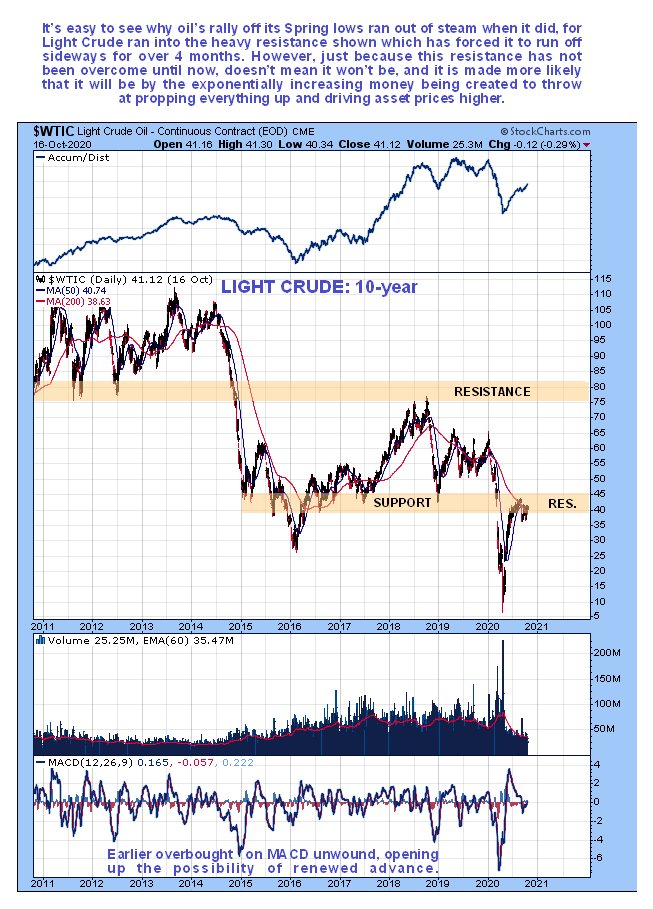 Alright, so if the stockmarket holds up and even accelerates to the upside due to runaway Fed money creation and oil surprises by taking off higher again for the same reason, then what is likely to happen to oil stocks? The 8-month chart for the oil index, which has the chart for Light Crude appended at the top, makes very clear that oil stocks have been underperforming oil markedly in recent months by trending lower. This suggests that oil sector investors are buying the obvious line that oil is doomed to drop again because of the dead economy, but as we have figured out above, that isn’t necessarily so if the Fed or its proxies take up the slack. What this means is that if oil does start to take off higher soon we are likely to have a strong rally in oil stocks that will probably be partly generated by those with short positions being caught out and scrambling to cover. 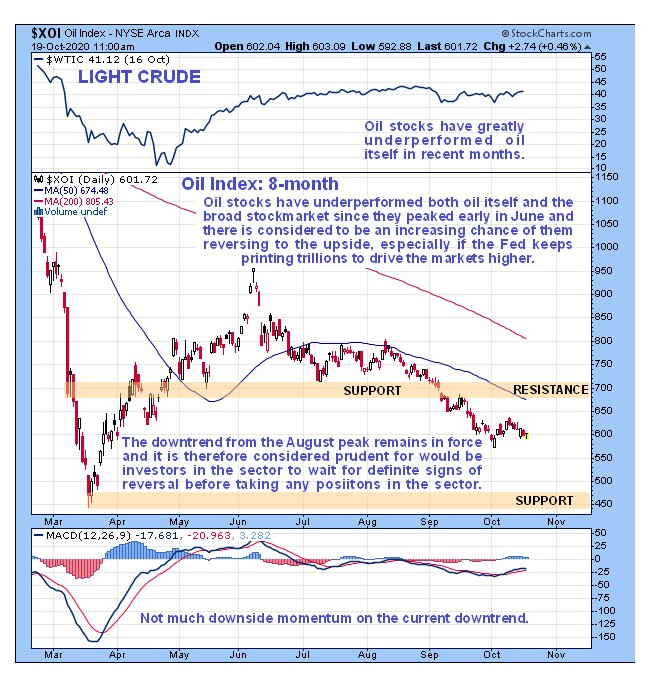 Finally, the 2-year chart for the oil index suggests that it might be about to form a Double Bottom with its March low, but because the current downtrend is much more gentle than the drop into the March low, it may well reverse to the upside before reaching that low, and the more that the index and its moving averages bunch together – and they are starting to bunch now – the more likely a sudden reversal to the upside becomes. 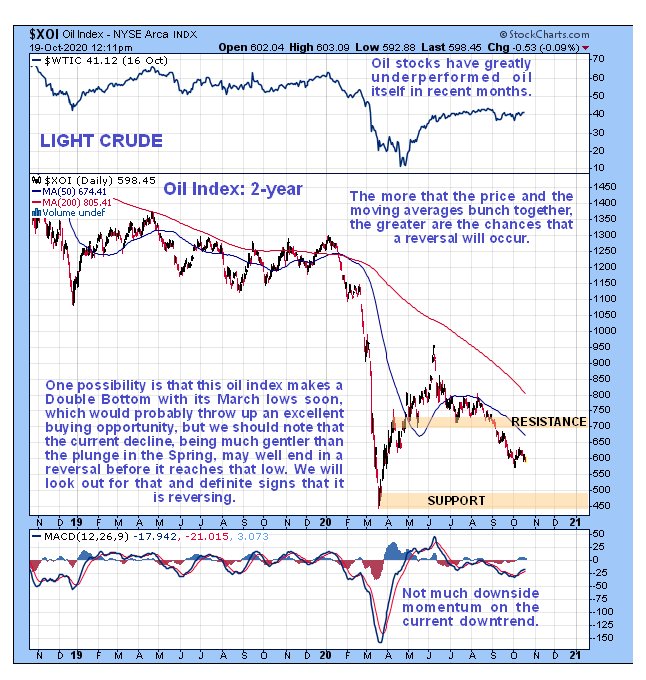 End of update. Clive Maund October 20th, 2020 support@clivemaund.com Clive Maund is an English technical analyst, holding a diploma from the Society of Technical Analysts, Cambridge and lives in The Lake District, Chile. Visit his subscription website at clivemaund.com .[You can subscribe here]. Clivemaund.com is dedicated to serious investors and traders in the precious metals and energy sectors. I offer my no nonsense, premium analysis to subscribers. Our project is 100% subscriber supported. We take no advertising or incentives from the companies we cover. If you are serious about making some real profits, this site is for you! Happy trading. No responsibility can be accepted for losses that may result as a consequence of trading on the basis of this analysis. Copyright © 2003-2026 CliveMaund. All Rights Reserved. |
| Home :: Archives :: Contact |
FRIDAY EDITION March 27th, 2026 © 2026 321energy.com |
|