|
TUESDAY EDITION April 15th, 2025 |
|
Home :: Archives :: Contact |
 |
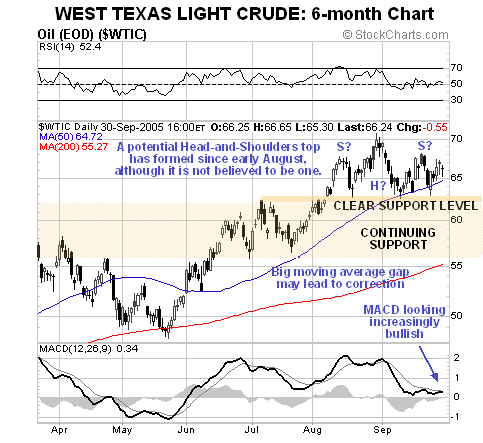
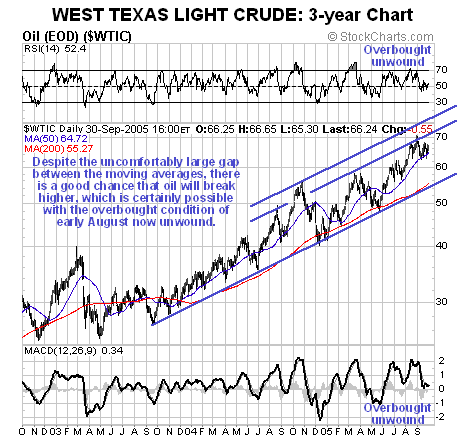
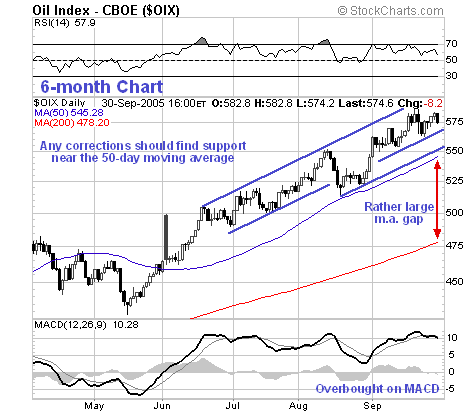
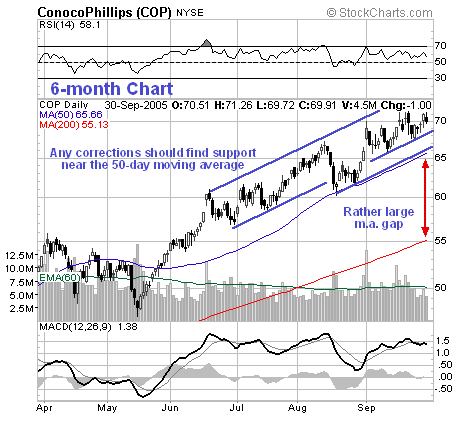
Oil Market updateClive MaundOctober 4th, 2005 Oil and oil shares remain in established, powerful uptrends, so that the only matter at issue for traders is that of sidestepping significant corrections within these uptrends, and timing re-entry points.  Following the rally of early August a trading range has developed in crude over the past 7 weeks, as can be seen on the 6-month chart for West Texas Light Crude below, from which the price is expected to break out before much longer. The direction of this breakout is difficult to call on this occasion, as although the sideways movement of the past 7 weeks has allowed the overbought condition that existed at the start of August to unwind, as shown by the RSI and MACD indicators at the top and bottom of the chart, the trading range does look like a Head-and-Shoulders top calling for an intermediate correction, which would be a reasonable development at this point given the yawning gap between the 50 and 200-day moving averages, that normally leads to a cyclical correction back towards the 200-day moving average. However, if asked to come off the fence, I would have to say that I believe this is going to break to the upside for several reasons, the chief of which is that the over!all uptrend in oil is believed to be accelerating. Another important reason is that, as we will see later, oil shares have continued higher while crude has traded sideways, and the oil shares have had a habit of presaging moves in oil itself. Still another reason is that the trading range of the past 7 weeks has formed above an important support level. Finally, short-term oscillators are starting to look bullish, with the MACD line on the 6-month chart looking set to break above its own moving average. Fundamental analysts would probably point to the lingering after effects of the Gulf hurricanes, the looming winter surge in demand, and the fact that many politicians in the current US administration have intimate links with the oil industry, their friends and associates in which are highly appreciative of the continuing rise in oil prices.  The 3-year chart for West Texas Light Crude gives greater overall perspective. This is obviously a very bullish chart, although as we can see, a large gap has opened up between the moving averages. In a steady uptrend this would be expected to lead to a correction shortly, but as already stated, the overall uptrend is believed to be accelerating. The best way for traders to handle this tricky situation is believed to be to remain long, and to buy at this point, for an anticipated upside breakout from the trading range, which will obviously involve a break clear above the psychologically important $70 level that capped the price in late August, but to exit should the price break below the clear support just below $63 on a closing basis, as this would be expected to signal an intermediate correction. This clear strategy affords a favourable risk/reward ratio, as risk is defined at a little over $3, while potential gains are relatively large.  Turning now to oil stocks we will start by looking at the 6-month chart for the OIX oil index. On this chart we see that while oil itself has traded sideways for 7 weeks, oil stocks have continued to march higher, signalling that oil is likely to break to the upside soon. However, by the same token, should this happen as expected, we will need to watch out for the oil stocks topping out ahead of oil itself, and it therefore makes sense for traders to start taking profits in oil stocks at the first sign of weakness in oil, or even as a strong uptrend in oil begins to decelerate. Note that any reaction by this index will probably terminate in the vicinity of its 50-day moving average, as happened on the mid-August reaction.  The 3-year chart for the OIX oil index shows the accelerating uptrend in oil stocks. There is no reason for longer-term investors to do anything other than stay long at this point, and selective new purchases with close stops can be made. The chart for the large oil stock that we are currently following in these updates, Conoco Phillips, necessitates no special comment, as it mirrors the oil index almost exactly.  On www.clivemaund.com we will continue to focus on those oil and gas stocks which have the greatest potential for large gains, without being excessively speculative, such as Abraxas Petroleum, recommended on the site last March at a price of $2.74, and whose latest chart is shown below.  Clive.Maund@t-online.de Clive Maund is an English technical analyst, holding a diploma from the Society of Technical Analysts, Cambridge and living in southern Bavaria, Germany. Visit his subscription website at clivemaund.com .[You can subscribe here]. No responsibility can be accepted for losses that may result as a consequence of trading on the basis of this analysis. Copyright © 2003-2005 CliveMaund. All Rights Reserved. |
| Home :: Archives :: Contact |
TUESDAY EDITION April 15th, 2025 © 2025 321energy.com |
|