|
MONDAY EDITION March 31st, 2025 |
|
Home :: Archives :: Contact |
 |
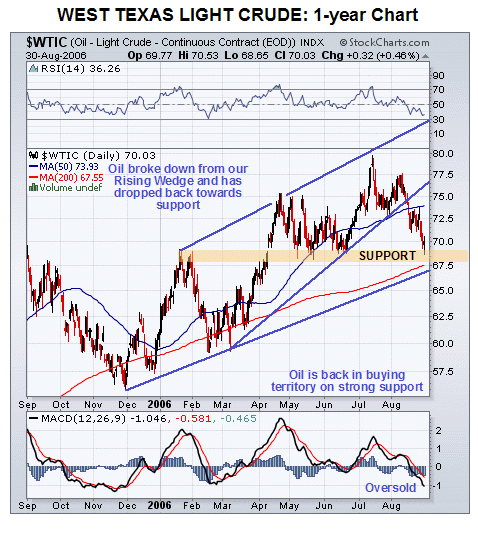
Oil Market updateby Clive Maundwww.clivemaund.com September 7th, 2006 Oil has behaved exactly as predicted in the last update, breaking down from an uptrend channel and dropping rather steeply towards important long-term trendline and moving average support in the $70 area. Fundamentally this decline has coincided with the cessation of hostilities in Lebanon. The August 31st deadline for Iran to cease Uranium enrichment came and went exactly as expected. Iran refused and President Bush said there must be “serious consequences”. By an interesting coincidence, there was an exact opposition of Saturn to Neptune on this day, an event which last occurred 36 years ago, before the OPEC oil embargo and the Yom Kippur war. Financial astrologers are agreed that this is an aspect of major significance. In Astrology, Neptune rules Oil. On this site we stick to the techniques of Technical Analysis, and these are indicating that, after the decline of recent weeks, oil is close to a low.
 On the 1-year chart for Light Crude we can see the recent decline, following the breakdown from the Rising Wedge channel, and how the price has been arriving in recent days at the zone where we had expected it to find support and turn up again. The support between the current price and about $67 is really strong, arising as it does from a long-term uptrend channel, the rising 200-day moving average, and the May and June lows, so it would be surprising and unusual if this support did not hold and turn the price back up again, especially given the aforementioned collision course between Iran and United States. Before leaving this chart, observe the MACD indicator at the bottom, indicating an oversold condition.
 On the 1-year OIX oil index chart we can see that oil stocks have reacted back somewhat over the past few weeks also as expected, although it must be said that, given the reaction in oil itself, this drop has been rather mild. At first sight this is still a rather threatening picture, as the pattern since late June looks like a potential Head-and-Shoulders top in the making. However, given the position of oil itself, and the outlook for Precious Metals stocks, which appear to be on the point of an important breakout, it is not thought that oil stocks will break lower here. Certainly the pattern that has formed since late June is a “Distribution Dome” resulting from prolonged profit taking, but the upleg that preceded it was unusually strong, implying that another up wave is likely to develop soon, despite the obvious downside risk at this juncture. A good way for agile traders to handle this situation is to buy here, but be prepared to make a swift exit in the event that the support line at 610, shown on the chart, is broken, the likely result of which would be a steep drop to the 570 - 580 area where the index would then be expected to turn up again. Clive Maundsupport@clivemaund.com Clive Maund is an English technical analyst, holding a diploma from the Society of Technical Analysts, Cambridge and living in southern in Copiapo, Chile. Visit his subscription website at clivemaund.com .[You can subscribe here]. No responsibility can be accepted for losses that may result as a consequence of trading on the basis of this analysis. Copyright © 2003-2006 CliveMaund. All Rights Reserved. |
| Home :: Archives :: Contact |
MONDAY EDITION March 31st, 2025 © 2025 321energy.com |
|