|
SUNDAY EDITION May 11th, 2025 |
|
Home :: Archives :: Contact |
 |
Oil Market UpdateClive Maund support@clivemaund.com May 20th, 2011 It's been a rough month for commodities so far, and that includes the oil sector which has fallen along with most everything else, but now there are signs that a reversal is at hand and that commodities as a whole and the stockmarket are set to turn up and stage a tradable rally, and the charts for the oil sector suggest that both oil and oil stocks will advance in tandem with commodities generally.
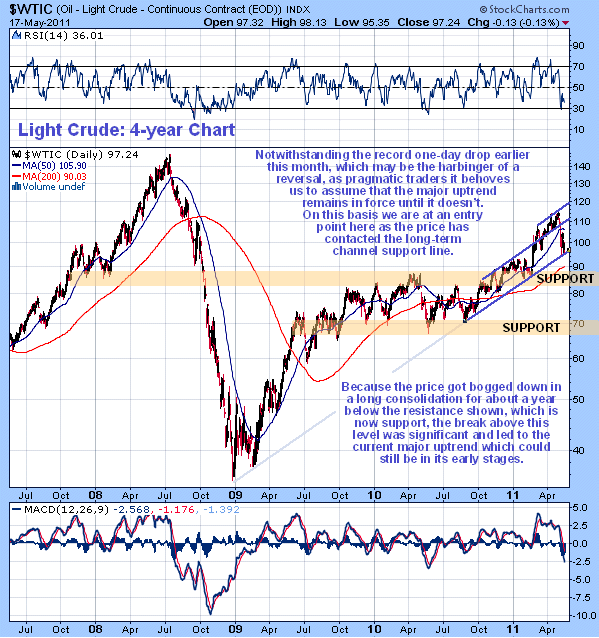 On its 4-year chart we can see that, after getting bogged down for about a year in a consolidation pattern, oil broke out upside and set off on another upleg towards its highs, and that, despite the sharp reaction this month, the long-term uptrend remains unbroken, so the current close proximity of the price with the support line of this uptrend makes oil a buy here, with a stop at a suitable distance beneath the support line. Here we should note that the record one-day drop in oil early this month, which got traders "all shook up", as Elvis would say, may have been an early warning signal of an impending bearmarket in the sector, short-term rally or not. However, with its long-term uptrend still intact and moving averages in bullish alignment it is still too early to call time on the oil bullmarket.
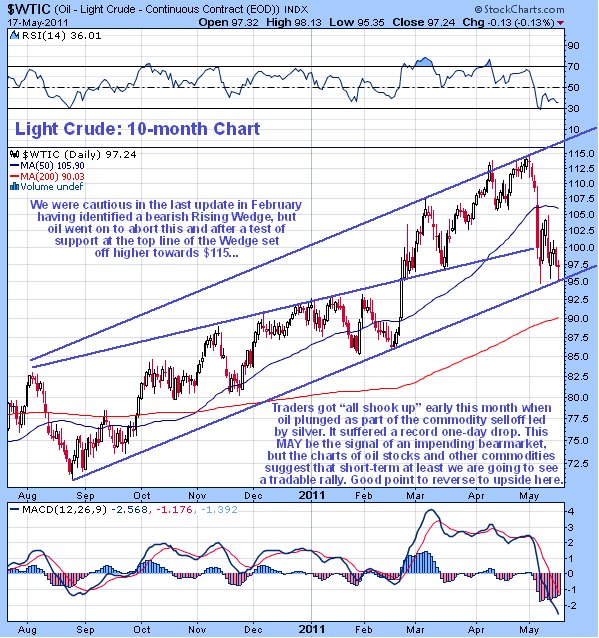 On the 10-month Light Crude chart we can see recent action in much more detail. Back in February we got cautious on oil too soon, having identified a bearish looking Rising Wedge on this chart, but as we can see it aborted with the price breaking sharply above it. That this channel was important is illustrated by the way the price reacted back to test support at its top line in March, before taking off higher again. Early this month, a day after the one-day plunge, the price dropped back into this channel again, which may have longer-term bearish implications, although the bottom line of this channel, tested over the past week, has held thus far. Right now, with oil deeply oversold on its MACD indicator, close to the bottom support line of the broader parallel channel shown, and quite some way below its 50-day moving average and above a still rising 200-day moving average, it is well placed to rally here, and the short-term bullish look of the oil stock index charts and of other commodities, notably copper, gold and silver increases the probability of a significant rebound soon.
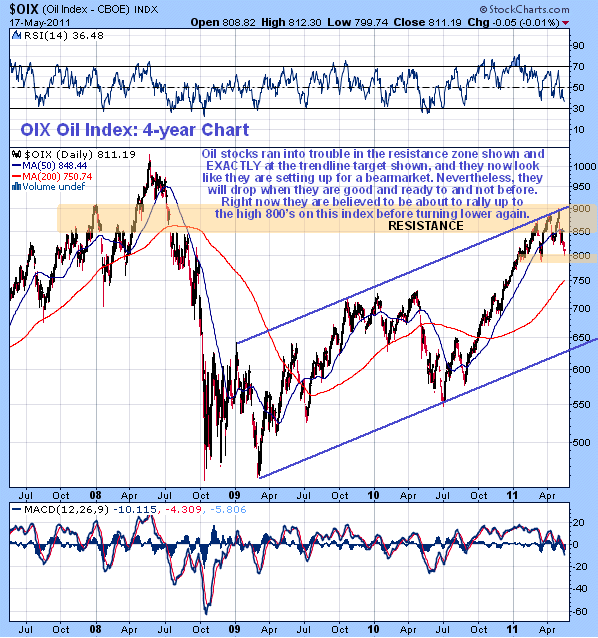 The 4-year chart for the OIX oil stock index certainly looks bearish for the longer-term, as oil stocks have rounded over and stalled out exactly at an important trendline target after a major advance, in a zone of strong resistance. However, this month's drop has brought them down to an important support level that we can just see on this chart at 800 and below, which is likely to generate a significant bounce, regardless of what happens longer-term, and we will now examine the strong uptrend from August of last year in more detail on a 10-month chart.
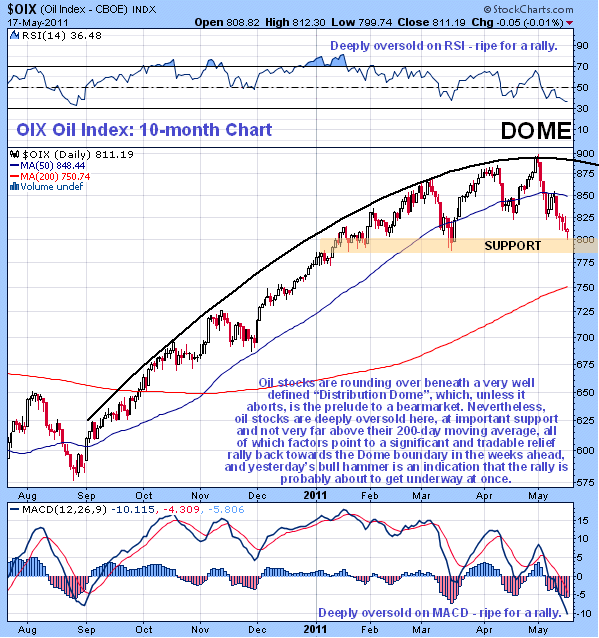 What is really striking on the 10-month chart for the OIX oil index is how the advance from last August has gradually decelerated and rounded over under what can be clearly defined as a large "Distribution Dome". These Domes are bearish, and unless this one is aborted, which can happen, a bearmarket is destined to develop in oil stocks in due course, the start of which will be signaled by the index breaking down below the support shown, so overall our general disposition towards the oil sector should be defensive. The timing for a breakdown into a bearmarket will be when the 50-day moving average closes up the gap with the 200-day, and the latter flattens out, and we are clearly some way away from that happening yet. Right now though this index is deeply oversold and at key support at the lower boundary of the potential top area, and symmetry strongly suggests that we see a rally soon back towards the Dome boundary, even if markets do drop twice as fast as they go up, which if it gets there will result in a 10% gain in this index. This is certainly tradable, especially given that a bull hammer appeared on the index yesterday signaling that short-term reversal to the upside is occurring, and one way of playing it is Call options in the biggest oil stocks which are duty bound to partake in a sector rally.
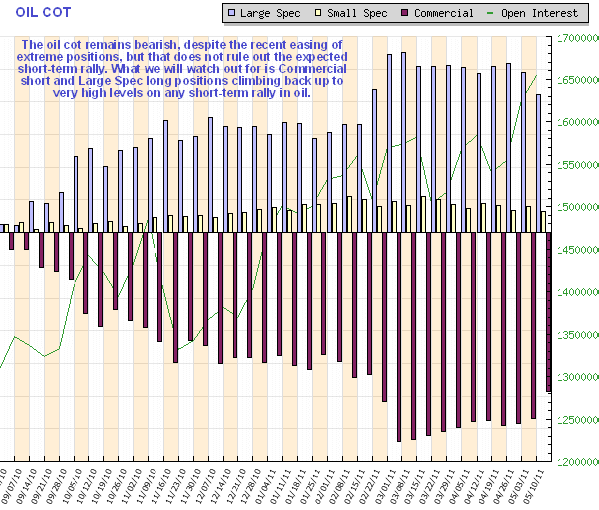
Despite its improvement last week as a result of the sector decline, the oil COT chart remains bearish, with persisting high Commercial short and Large Spec long positions, a situation that does not bode well for the sector longer-term unless it rapidly improves in coming weeks. This however does not preclude a short-term rally that we are expecting. If our interpretation is correct what is likely to happen is that the Commercial short and Large Spec long positions will expand back towards the extremes we have seen in recent months, as the rally unfolds and approaches completion. If it does we may stand ready to short the sector.
|
| Home :: Archives :: Contact |
SUNDAY EDITION May 11th, 2025 © 2025 321energy.com |
|