|
TUESDAY EDITION June 9th, 2026 |
|
Home :: Archives :: Contact |
|
|
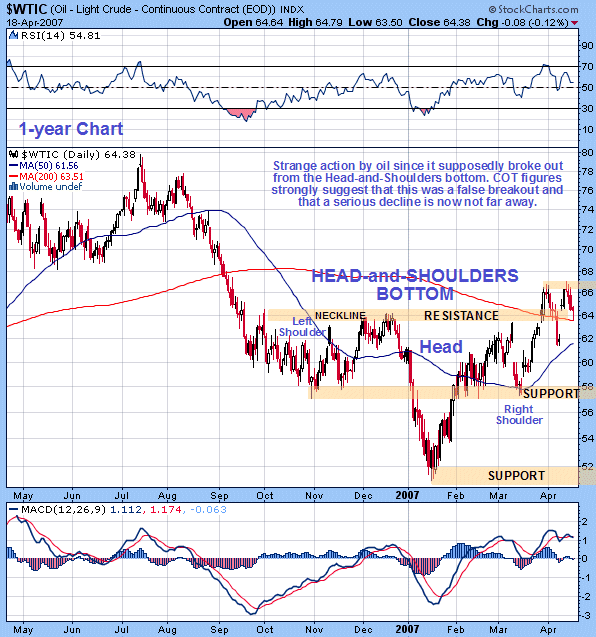
Oil Market UpdateClive Maund April 22, 2007 A very bearish divergence has opened up on the Crude Oil COT chart, which is nice to know, given the fact that the price can’t seem to make its mind up whether it wants to remain above the key $64 level or not.
On the 1-year chart for Light Crude we can see how the price seemed to break out from the large potential Head-and-Shoulders bottom late last month, when it jumped above $64, but since that time it has been zig-zagging erratically around this level, with the market in a seemingly undecided state. This kind of action is hardly surprising given recent developments. Just a few weeks ago it looked quite likely that Iran would be bombed, and it is this possibility that is thought to have been responsible for the price rising up from a low in mid-March near $57.40 to its recent peak towards $67, but since then it has remained unclear just what, if anything, is going to happen in the foreseeable future.
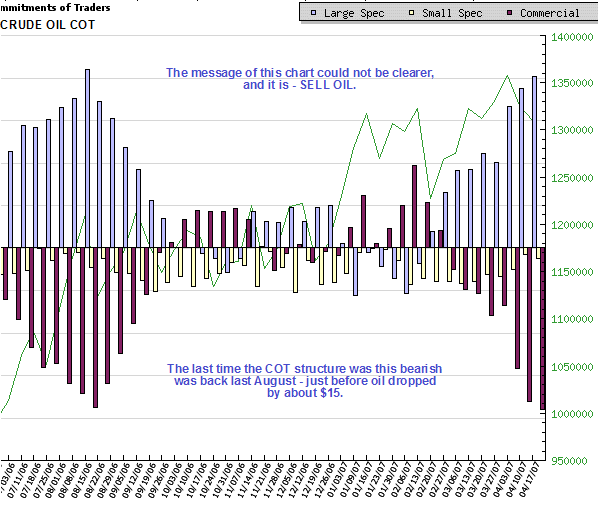
Although the price of oil may have been wandering around erratically these past weeks after a significant rise, the same can certainly not be said of the COT chart, which has been showing a steadily increasing bearish divergence that began as long ago as the start of March, that bearish divergence being a big increase in Large Spec long positions coupled with a big increase in the Commercials short positions. Experience has shown that a divergence of this kind invariably leads to a substantial decline, and what that implies is that the market is suddenly going to realize that there isn’t going to be an attack on Iran - at least not for some time. Oil is therefore expected to drop substantially, at least to the support in the $58 area.
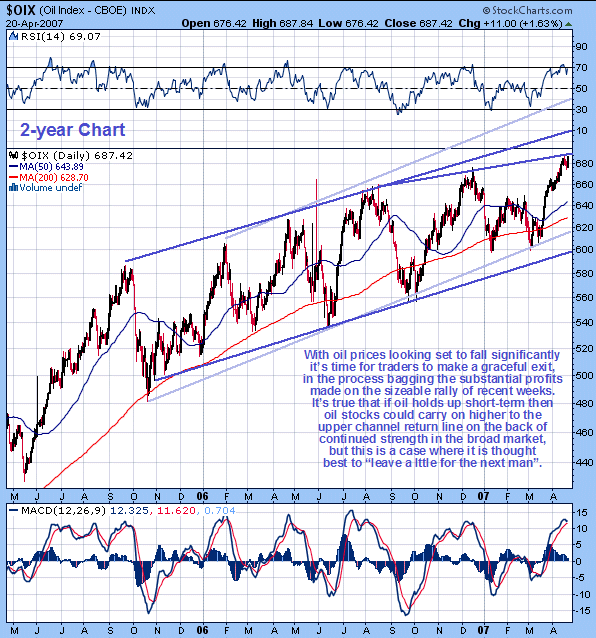
While oil itself is likely to decline in price, at least for a while, oil company stocks may ironically be buffered from serious losses by a generally rising stockmarket, resulting in part from - you guessed it - falling oil prices, and from the fact that the big profits arising from recent relatively high oil prices are still working their way through to oil company’s bottom lines. Nevertheless, a glance at the 1-year chart for the OIX oil index quickly reveals that it would probably be wise to start pulling money out of this sector without delay. The index has risen to hit the lower of a several trend channel return lines. Clearly, if oil succeeds in holding up for a few weeks longer, oil stocks may run to the next return line on the back of the broad stock market continuing to rally, but if oil does turn sharply lower soon, as looks likely from the COT chart, oil stocks could be at the top right now.
Clive Maund |
| Home :: Archives :: Contact |
TUESDAY EDITION June 9th, 2026 © 2026 321energy.com |
|