|
SUNDAY EDITION May 11th, 2025 |
|
Home :: Archives :: Contact |
|
|
Oil Market Update - sector arriving at heavy resistance...Clive Maund March 16th, 2021 Oil has had a remarkably strong run over the past year, considering that the economy is dead, recovering from almost zero to get back up to the current $65 or so. The reason for this is a combination of powerful vested interests that depend on a robust oil price colluding to drive it back up combined with the creation of trillions of dollars out of thin air to keep the system limping along and drive markets back up. Now, however, there are signs that we have seen the best of this run and further progress is going to be much more difficult. On the 3-year chart for Light Crude we can see the big recovery over the past year, and how it was comprised of two large upwaves, the first being the recovery out of the freak lows of last April at the depths of the market crash, when oil become temporarily worthless, and in fact you had to pay people to take it off your hands. The second upwave followed a reaction into October, and looks like it was caused by a surge of liquidity hitting this market. This 2nd upwave was large, and caused the oil price to almost double from its October lows. Now though it looks like this uptrend may have about run its course, as the price has arrived at a zone of significant resistance at its 2019 highs in a quite overbought state on its MACD and relative to its moving averages. 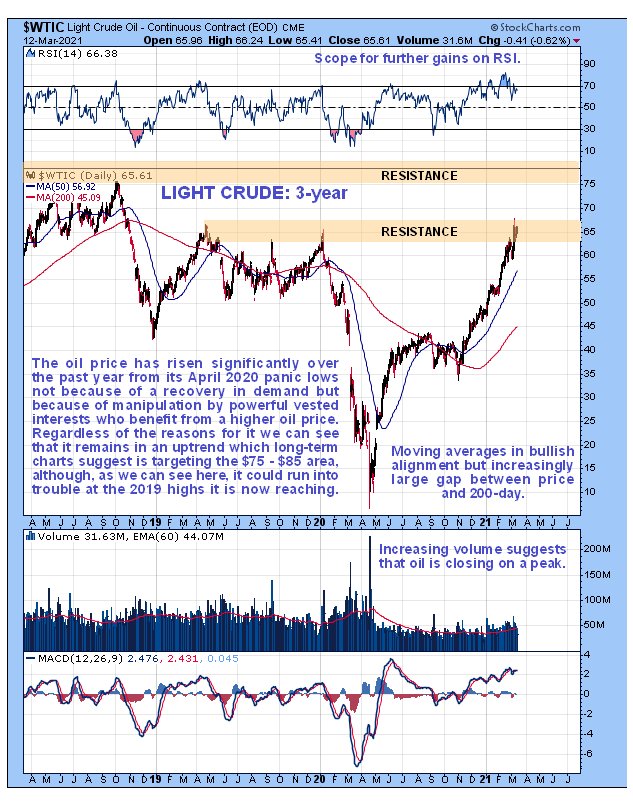 On the 10-year chart however, we see that should it succeed in breaking above this resistance, as it well could if another liquidity surge drives markets higher still - and commodities are coming back into favor - then it is likely to push on into the zone of stronger resistance in the $75 - $85 zone, which would be a probable upside target, barring imminent hyperinflation. 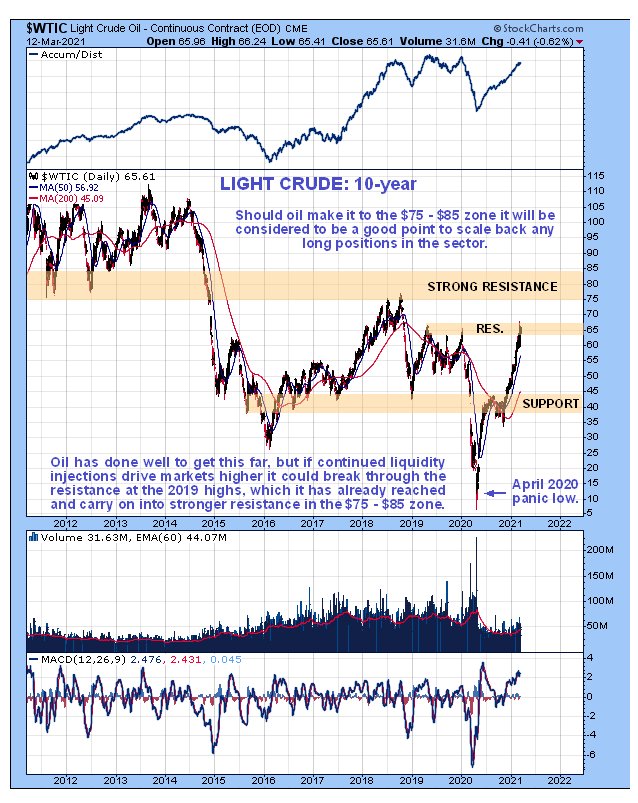 The charts for the XOI oil stocks index that we will now look at provide a stronger indication that the time may have come to start scaling back holdings / taking profits across the sector. On the 3-year chart we see that the index has doubled from its October lows, which is a big move for the entire sector, and is now running into a zone of quite strong resistance in an overbought state. Whilst this is a warning, it should be noted that it could push on even higher into the upper band of resistance shown in the 1250 - 1300 area in the event that oil pushes on to the $75 - $85 zone, which of course is not impossible given the tidal wave of liquidity being thrown at driving markets higher. 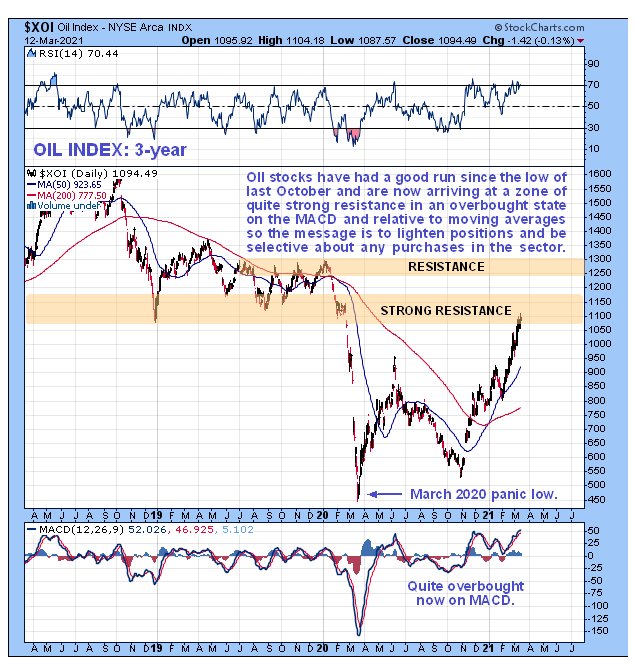 On looking at the 10-year chart for the XOI index we see that the resistance that we have observed in this zone on the 3-year chart is even stronger than one would think looking just at the 3-year chart, for there was a lot of trading in and above this area going right back to 2011. This is why it is considered prudent for investors in the sector to start selectively cutting back positions now, rather than waiting to see if it can drive higher to the upper resistance level. 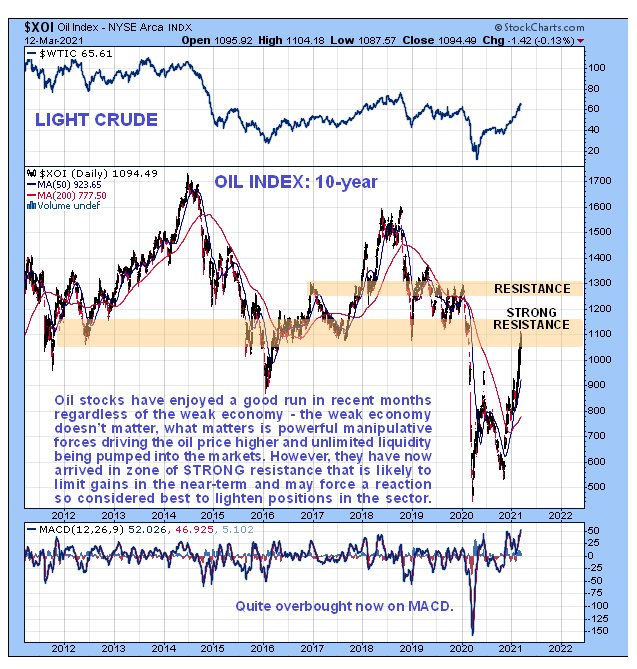 End of update. Clive Maund March 16th, 2021 support@clivemaund.com Clive Maund is an English technical analyst, holding a diploma from the Society of Technical Analysts, Cambridge and lives in The Lake District, Chile. Visit his subscription website at clivemaund.com .[You can subscribe here]. Clivemaund.com is dedicated to serious investors and traders in the precious metals and energy sectors. I offer my no nonsense, premium analysis to subscribers. Our project is 100% subscriber supported. We take no advertising or incentives from the companies we cover. If you are serious about making some real profits, this site is for you! Happy trading. No responsibility can be accepted for losses that may result as a consequence of trading on the basis of this analysis. Copyright © 2003-2025 CliveMaund. All Rights Reserved. |
| Home :: Archives :: Contact |
SUNDAY EDITION May 11th, 2025 © 2025 321energy.com |
|