|
SUNDAY EDITION May 11th, 2025 |
|
Home :: Archives :: Contact |
 |
Oil Market UpdateClive Maund support@clivemaund.com February 10th, 2010 With another deflationary downwave threatening until a couple of weeks ago, both oil and oil stocks were on the verge of breaking down and would of course have plunged along with everything else in the event that the threat had become reality. The message of the markets over the past week or two, however, is that the danger has passed, at least for the foreseeable future. Of particular interest are the latest COT charts, which reveal that the Commercials have been drastically scaling back their short positions across the board, notably in gold and silver but also in oil where the Commercials' short positions have nosedived from very high levels to a modest level in just 3 weeks. This is taken as a clear sign that the danger of these markets continuing lower is fast receding - on the contrary, they are likely to rise substantially. 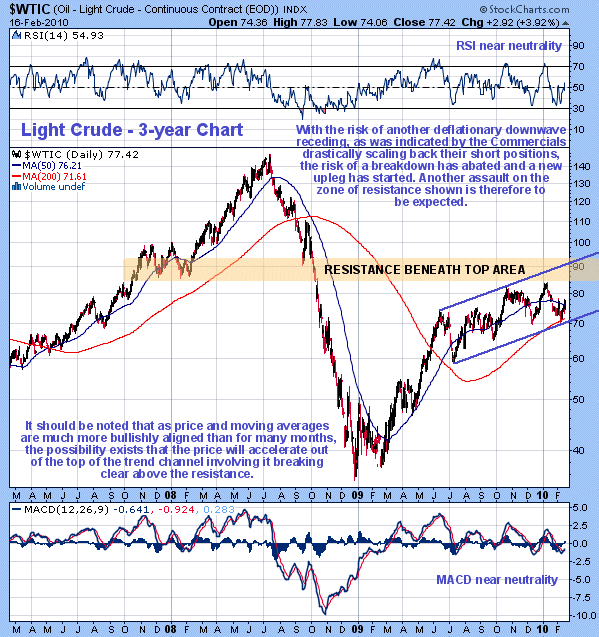 On the 3-year chart for Light Crude we can see how, after the steep recovery uptrend from February through June last year, it has since stalled out in a gentle uptrend beneath resistance at the lower boundary of the large top area. In the last update we took the latter part of this uptrend to be a probable top area, which was not unreasonable given the big Commercial short position that had built up - it appears that we were in good company. However, we have since seen a dramatic easing of deflationary fears over the past several weeks, at least as harbored by "Smart Money", which is evidenced by the contraction of the aforementioned Commercial short positions, and a wide range of commodities bouncing back, such as copper, gold, silver and oil, with the broad stockmarket, oil stocks and Precious Metals stocks rallying away from the danger zone in recent days. The action in copper in particular highlights how an acute deflation panic has been swiftly followed by a huge sigh of relief as the danger has apparently been averted - copper plunged before turning on a dime and staging a vigorous rally, leaving behind an "icicle" bottom on its chart. The means used to stave off deflation are of course highly inflationary, which is good news for commodity and stock prices which can be driven to higher and higher levels by the combination of a continuation of the manufacturing of money and speculation fuelled by hot money feeding on carry trade differentials to chase momentum. Thus, a resumption of the bullmarket advances in commodities and stocks would appear to be in prospect. Looked at in this light the gentle uptrend in oil since last June may turn out to be a period of consolidation beneath resistance following the strong gains between last February and June, that could be followed by a more rapid uptrend should the resistance be overcome. This notion is supported by the current alignment of price and moving averages, which is more bullish than it has been for a long time, with price and moving averages now bunched tightly together and the 200-day m.a. rising, making a breakout above the resistance in the $86 - $94 zone an increasing probability before much longer, which also fits with the expected strong uptrends in gold and silver. 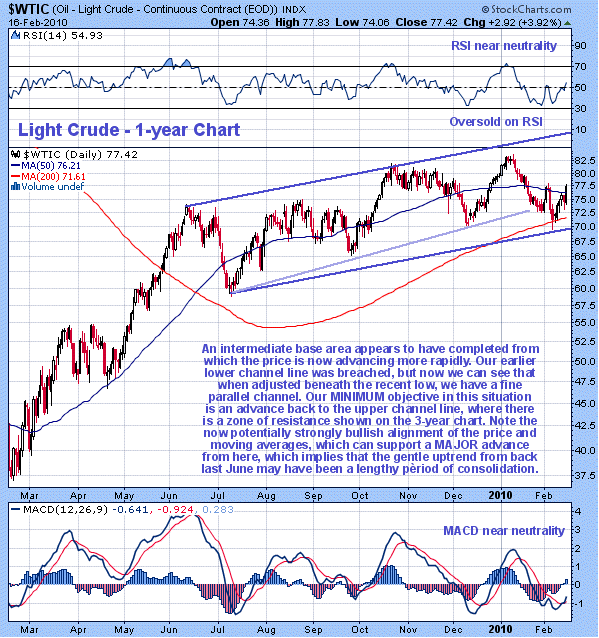 On the 1-year chart for Light Crude we can see recent action in more detail. This chart shows how the duration of the gentle uptrend from last June has allowed the 200-day moving average to swing from bearish to bullish alignment and to catch up with the price, increasing the chances of a more vigorous advance developing that would take the price up and out of this channel. The price of oil is just recovering following a successful test of the lower channel support line and the 200-day moving average and it is now ready to advance away from the newly completed intermediate base area and is expected to make it to the top line of the channel as a minimum objective. 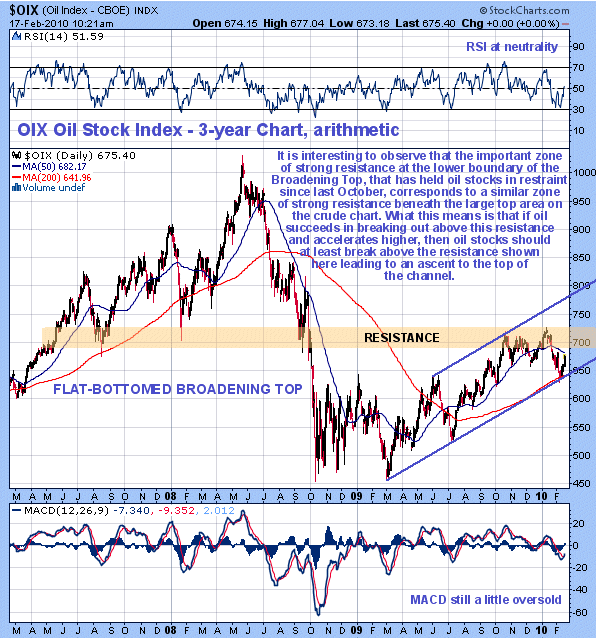 The 3-year chart for the OIX oil index shows that, like oil itself, oil stocks have been marking time beneath an important zone of resistance for many months, although as serious resistance did not come in until the 700 area was reached, they were free to advance for longer than oil, their ascent only being arrested last October. As we can see this resistance is at the bottom of a large Flat-bottomed Broadening Top. On an arithmetic chart this index has been in a fine parallel uptrend channel that dates back to the low of March last year, with the price/time correction since October resulting in a recently successful test of the lower channel boundary and 200-day moving average from which it is now picking up. Had the deflationary scenario prevailed the channel would of course have failed and the index plunged. If we compare this chart with the 3-year chart for oil itself it is quite obvious that should oil succeed in breaking out above its resistance in the $86 - $94 zone as now looks quite likely, the OIX index will break above its resistance in the 690 - 730 area, which should lead to an ascent to the upper boundary of the trend channel, now at 780 and rising. 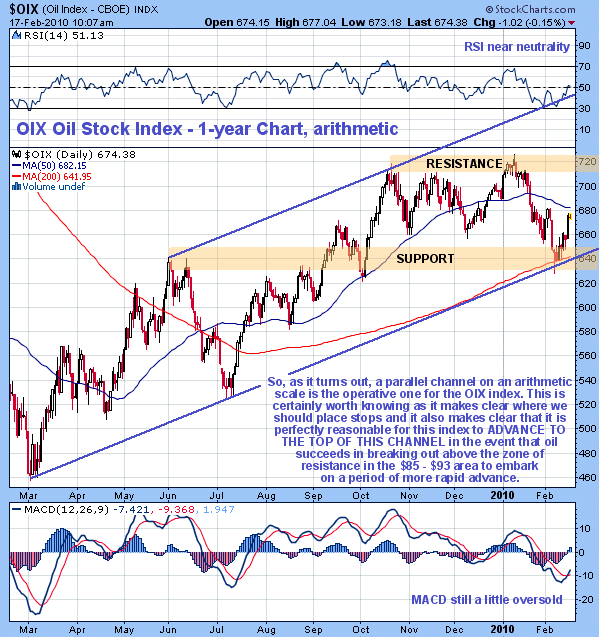 The fact that the OIX index is advancing within the confines of a fine parallel channel that we have been able to delineate on an arithmetic scale is a very useful thing to know. It allows us to go long oil stocks, knowing where to set general protective stops to take us out in the event of the channel failing (3% below the lower channel boundary). It also enables us to project a rising upside target at the upper boundary of the channel, which as we can see is currently at a much higher level at about 780 than where we are at present. The first hurdle on the way up will be the resistance at the October and January highs. Yesterday the index broke decisively above the downtrend in force from early January, and while it may back and fill for a little while before it overcomes the minor resistance level just above 680 near the 50-day moving average, it should then continue higher. 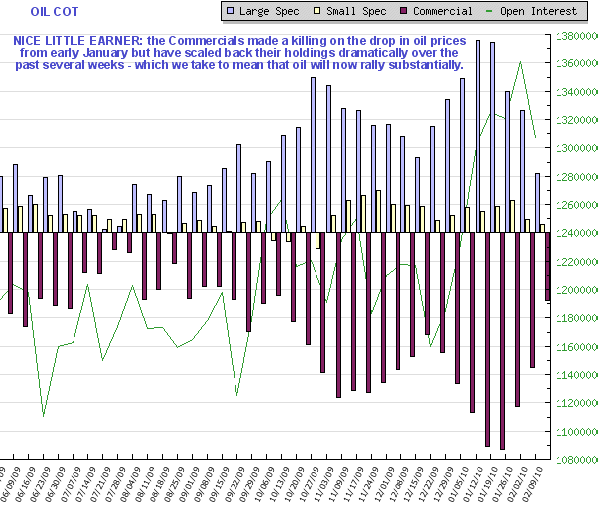 Finally the last COT chart reveals a dramatic drop in Commercial's short positions over the past several weeks, consistent with what we have seen in copper, gold and silver, suggesting that not just oil but the entire commodities complex is set to advance. Clive Maund February 10th, 2010 support@clivemaund.com Clive Maund is an English technical analyst, holding a diploma from the Society of Technical Analysts, Cambridge and lives in The Lake District, Chile. Visit his subscription website at clivemaund.com .[You can subscribe here]. Clivemaund.com is dedicated to serious investors and traders in the precious metals and energy sectors. I offer my no nonsense, premium analysis to subscribers. Our project is 100% subscriber supported. We take no advertising or incentives from the companies we cover. If you are serious about making some real profits, this site is for you! Happy trading. No responsibility can be accepted for losses that may result as a consequence of trading on the basis of this analysis. Copyright © 2003-2009 CliveMaund. All Rights Reserved. |
| Home :: Archives :: Contact |
SUNDAY EDITION May 11th, 2025 © 2025 321energy.com |
|