|
TUESDAY EDITION June 9th, 2026 |
|
Home :: Archives :: Contact |
|
|
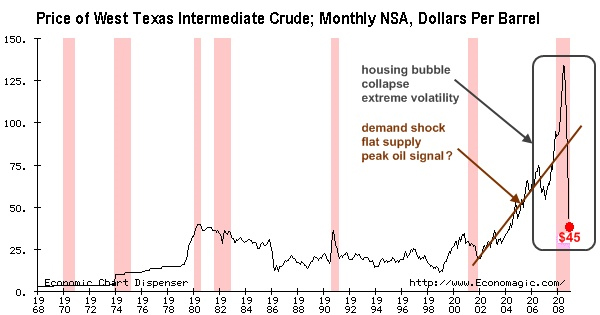
The Price Is Not RightDave Cohendave.aspo@gmail.com December 20, 2008 Abandon all hope ye who enter here — Dante Alighieri, The Divine Comedy The ideas of economists and political philosophers, both when they are right and when they are wrong, are more powerful than is commonly understood. Indeed the world is ruled by little else. Practical men, who believe themselves to be quite exempt from any intellectual influences, are usually the slave of some defunct economist. Madmen in authority, who hear voices in the air, are distilling their frenzy from some academic scribbler of a few years back. — John Maynard Keynes Today's NYMEX WTI oil price, about $45/barrel, is dangerously, outrageously low. Crude oil is not some "inconsequential penny stock" as Clive Maund pointed out, but that's how it's been priced (321Energy, November 19, 2008). I am going to talk about how oil prices get set in a futile attempt to understand what future prices might look like. I find little reason for optimism regarding the market's ability to provide a coherent oil price signal reflecting future scarcity of this precious non-renewable resource. Figure 1 is taken from James Hamilton's Understanding Crude Oil Prices (UCSD Department of Economics, November 7, 2008). 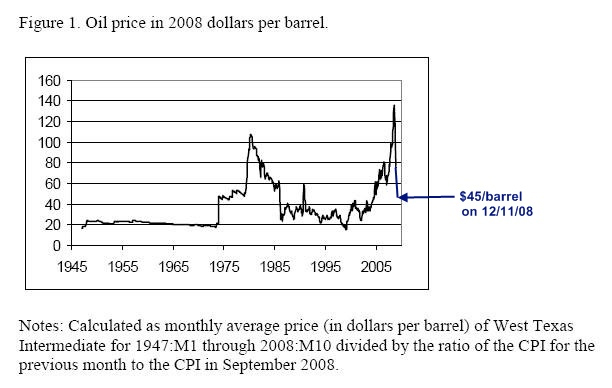 Figure 1 — Updated (in blue) to reflect the current price The only price run-up that is nearly comparable to 2007-2008 took place in 1979-1980 at the time of the Iranian Revolution, which was followed a short time later by the Iraq-Iran war. There is no historical analogue to the current crash which has seen the price fall about 67% in less than 6 months. A view of historical nominal prices (Figure 2 below) is even more shocking.
Figure 2 — Nominal Prices 1968-2008, pink bands indicate recessions (source here)
Let's turn to Hamilton and some related materials to examine theoretical views on how oil prices are set over time. The Hotelling View of Oil Prices Harold Hotelling (1931) defined the classical economic theory1 of the long-term pricing of non-renewable resources like conventional oil. The theory states that the price of a depleting resource like conventional oil should rise over time at the interest rate because it's value should increase as the stocks (reserves) are exhausted. Tobias Kronenberg, author of Should We Worry About the Failure of the Hotelling Rule?, explains: The difference between resource price P and marginal cost mc in this case is not a profit in the economic sense. It is a `royalty', or the in situ value of the resource. The latter term is derived from Latin, meaning "in place", so it is the value of leaving the resource in place instead of removing it. Expressed in more common words, it is the opportunity cost ? of extracting the resource, because extraction now means that less extraction is possible in the future.... We thus can see that actually it is not the resource price which grows at the rate of interest, but the in situ value of the resource What resource economists call the "in the ground" value (aka. the in situ value, the opportunity cost, the scarcity rent) of a finite resource should grow over time as the reserves are exhausted. This is just commonsense. As the oil is extracted over time, it becomes more precious because there's just so much of it. For the sake of argument, let's say that the world's ultimately recoverable reserves of conventional oil amounts to 2.3 trillion barrels. Of that original endowment, the world has already consumed 1.1 trillion barrels. Clearly the remaining 1.2 trillion barrels should grow in value (expressed in dollars per barrel) as it is extracted and consumed over time. Hotelling's rule states price of conventional oil should increase at the (compounded) rate of interest to reflect its growing scarcity. The Hotelling rule forms the basis of the economic theory of non-renewable resources. It is simple, elegant, well-justified within general macroeconomic theory, and entirely worthless as a guide to past and future prices. From Hamilton— Although Hotelling’s theory and its extensions are elegant, a glance at Figure 1 [above] gives us an idea of the challenges in using it to explain the observed data. The real price of oil declined steadily between 1957 and 1967, and fell quite sharply between 1982 and 1986... Various attempts have been made to save the Hotelling rule by considering technological progress or reserves additions over time, but ultimately these moves are pointless. The simplest hypothesis that explains the failure of the Hotelling theory is also the correct one. Hamilton puts it this way—
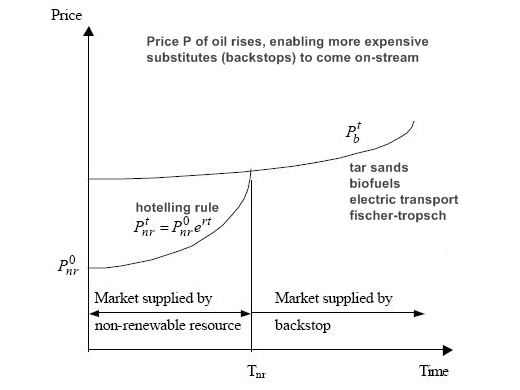
Oil has never been priced as a non-renewable resource. So where does that leave us? The oil price is not right. Changing Clive Maund's "penny stock" analogy, oil is priced as if it were soybeans, a renewable crop, or iron, for which reserves are vast and therefore not a concern. One estimate for the marginal production costs for new oil projects is $62/barrel and that cost has been growing over time. Randy Ollenberger, managing director of North American energy equity research for BMO Capital Markets, focused on supply, noting that a survey of 200 oil and gas companies shows the oil price required to allow new oil projects to break even has climbed from about $18 US per barrel in 1999 to $60 in 2007 and an estimated $62 now. Not only is the assumption of a constant marginal production cost wrong, but the current NYMEX WTI price is $17 below the current cost. And since $62 is a break-even price, the price would likely need to be $75 or above to justify development of new oil projects. This is the price the Saudis recently said was required to maintain world oil production. That oil is not priced as a depleting resource has consequences. The simple Hotelling rule lays out a path by which so-called backstops (substitutes) for oil are enabled as the price rises over time in Figure 3.
Figure 3 — Hotelling scenario with backstops. From Neha Khanna here. In addition to jeopardizing future conventional oil projects, oil at $45/barrel makes new tar sands production uneconomic, has the same effect on biofuels, and discourages development of more fuel efficient vehicles. Thus the low oil price is a disaster which grows worse the longer it goes on. So if oil is not priced "correctly" according to its relative scarcity, how is it priced? It's mostly downhill from here.
Random Walks Hamilton considers the statistical predictability of oil prices. Pretend there's no such thing as a supply & demand fundamental like rising demand in China or dwindling supplies from the North Sea. Simply view the oil price as a numerical time series. In Random Oil, Jerry Taylor and Peter Van Doren2 of the libertarian Cato Institute argue that in principle oil prices are unpredictable, not only in the short-term but in the long run as well. Long-run forecasts are no easier to execute. Professor Vaclav Smil of the University of Manitoba has cataloged the vast record of energy forecasts offered by academics, corporations, consultants, trade associations, government agencies, "blue ribbon" commissions, policy activists and "futurists" of all stripes over the past 100 years and finds a "a manifest record of failure." There is simply no reason to believe that mere mortals can foretell oil prices or petroleum market shares in the future, absent some sort of time machine. Indeed, Hamilton himself concludes that historical oil prices exhibit "a random walk without drift" in that part of his paper in which he confines himself to a statistical analysis. Based on derived data in Hamilton's Table 2, Taylor and Van Doren created Figure 4 to demonstrate that future oil prices can vary over a very wide range very quickly from some initial price point. Hamilton finds that the [historical] standard deviation in oil prices from quarter-to-quarter was 15.28%. Hence, if we start a quarter with $115 oil, prices in the next quarter could average between $85 and $156 per barrel. In a year, they could range between $62 and $212. In four years, they might be anywhere between $34 and $391! 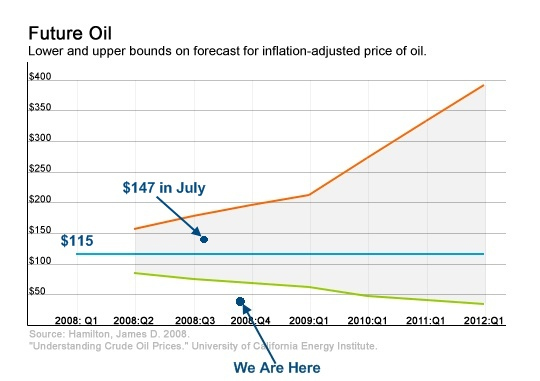
Figure 4 —A Random Walk? This is the 95% range based on an initial price of $115/barrel Even worse, the "best" predictor of future oil prices is said to be the current oil price! Since the current oil price is also a "lousy" predictor, there is simply no way to forecast future oil prices. Of course, if oil prices were to rise — or decline — to the upper or lower boundary of our "random walk," market analysts and policy pundits would likely wet their pants over "the end of the oil age" (in the case of the former) or the end of OPEC (in the case of the latter). While trends in those cases would be perfectly consistent with either narrative, they would also be perfectly consistent with a random walk ... and no real trend. I take no great pleasure in pointing out that the $45 is well outside Hamilton's future price funnel, which does indeed indicate the inability of OPEC to set a reasonable floor price for oil up to now. More to the point, $45 for a barrel of oil signals that something very strange and ultimately tragic is going on in the oil markets. Although a purely statistical take on historical oil prices3 displays no discernible pattern, commodity prices do not exist in a vacuum. What do you think the chances are that the oil price will randomly walk itself up to $100/barrel in the next 2 quarters? The chance is so slight that it is indistinguishable from zero. The oil price reached historic highs earlier this year because the world's economies were demanding lots of the stuff. The problem was that supply could not meet demand, which was reflected in inventory levels (see below). With the crash of the global economy, which has dramatically lowered demand for oil, the price has crashed. Taylor and Van Doren approvingly cite Hamilton's observation that "neither nominal U.S. interest rates nor real U.S. GDP growth rates can predict oil price movements." It would be surprising if any single variable could be used to forecast the oil price. Oil consumption is interwoven into everything that people do, from growing food to manufacturing computers to going shopping. Saying that the relative movements of the oil price are driven by supply & demand fundamentals is not the same as saying that today's low price is entirely justified by those fundamentals. Ditto for last summer's high price—this is the issue under discussion here. Let's move on to see how short-term oil prices are actually set. Voodoo in the Trading Pits, Technical Analysis The intrepid reporters at National Public Radio did us all a great service on December 11, 2008 when they ran the story Oil Traders Find a Profit in 'Voodoo' Science. I expected the traders I met here [in the NYMEX pit] to be experts in oil shipping schedules and the politics of distant places like Saudi Arabia and Azerbaijan. But trader after trader told me that while they do watch the news, they have easier ways of predicting the markets. They print out the charts of where the market has been — the peaks and valleys. Then they draw lines off into the future. Of course this method of buying and selling is called technical analysis. The aforementioned Clive Maund carried out such an analysis in his November 19 Oil Market Update. Here's part of his chart— 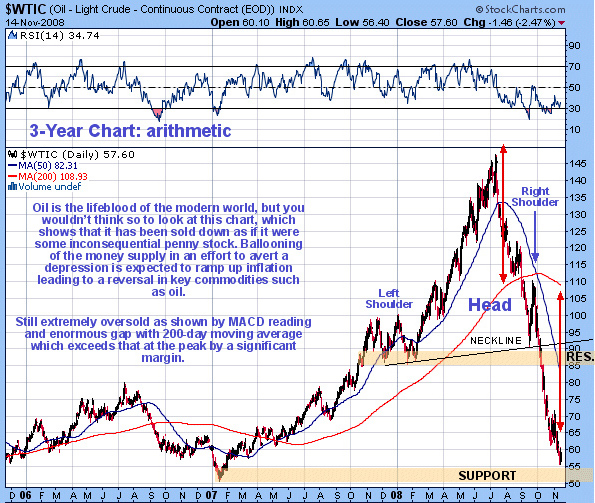 Figure 5 — A "3 bumps" technical analysis from Clive Maund (shoulders and head) I do not mean to criticize Maund, who wrote his market update for our benefit and whom I greatly respect, but this method of determining oil prices really is black magic. People do make money from it, but the obvious problem is that if all the experienced traders are doing the same technical analysis, you get a self-fulfilling prophesy. Profits to traders mindful of the "head and shoulders" effect would have averaged 10 percent to 20 percent a year, better than returns from the stock market. Carol Osler, a professor of finance at Brandeis University, says she still has no idea why this stuff works... Let's press on, exploring how technical analysis relates to the psychology of markets and how supply & demand drive the oil price over the long term. The Central Mystery I am sure we are all heartened by the knowledge that oil traders watch the news, which goes to show that they are not completely unaware of long-term fundamentals in the oil market. From Hamilton's concluding remarks— Unquestionably the three key features in any account [of what produced the high price of oil in the summer of 2008] are the low price elasticity of demand, the strong growth in demand from China, the Middle East, and other newly industrialized economies, and the failure of global production to increase. These facts explain the initial strong pressure on prices that may have triggered commodity speculation in the first place. How does a series of short-term price movements calculated by drawing Gann angles or other lines off into the future price oil correctly according to supply & demand fundamentals over the longer term? The short answer is inventory movements. Here is an augmented version of how oil pricing works from Ferdinand Banks' Speculation and the Price of Oil (321energy, August 26, 2008). 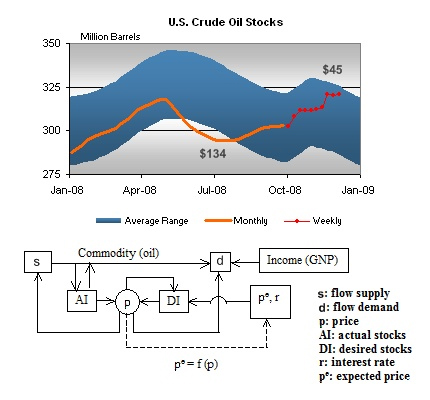 Figure 6 — Simple pricing model and U.S. crude oil inventories in 2008 (stocks = inventories) Read the section of Banks' article entitled What they should and could have taught you in Econ 101 about the pricing of oil for details about how the model works. Here are the takeaway points:
If this were all to it,4 economists like Nobel Prize winner Paul Krugman, elaborating a "1970s-vintage portfolio balance model" based on the work of Mark Thoma, could stop debunking all that talk last summer about speculation. But the Dismal Science that rules our lives never sleeps— First, we suppose a demand for inventory that depends on the interest rate minus the expected rate of increase in prices: ND = N(i-(PE-P)/P) ... Theoretical niceties that capture expectations about price keep academic economists busy, but what are they really modeling? Here we approach what I will call the Central Mystery of oil pricing. What is modeled is the collective behavior over time of all the traders of physical and paper oil with an active interest in futures contracts, including the all-important front month. And in the end, as General "Buck" Turgidson said in Dr. Strangelove after the planes were in the air, we must finally "admit that the human element seems to have failed us here." Each week traders evaluate inventory levels against expectations on Wednesday after the EIA data is released, but they are drawing off lines into the future, apparently the same lines, on all the other days. We speak casually of a "bearish" or "bullish" mood in the market because traders move as a herd. The professional traders, the ones who make money, lead the pack, while the amateurs take up the rear. Group psychology runs the show. Don't believe me? Consider Hurricane Ike's effect on oil prices back in September. As Ike bore down on the Texas coast on Friday September 12th, the DOE announced that "95.9 percent of the Gulf of Mexico's 1.3 million barrels per day of oil production" was shut-in. On that day oil briefly fell below $100/barrel for the first time since April 2nd, but closed up 31 cents at $101.18. By Sunday, when it was apparent that the damage had fallen short of expectations, oil resumed its bearish run. “We’re going to be coughing and wheezing in terms of supply for a couple weeks or so,” [Tom] Kloza said. “A lot of days of production were lost.” Even so, he said, “by Wednesday or Thursday, it’s not going to be a big story.” It is patently absurd for oil prices to fall with over 1.2 million barrels per day shut-in, but there you have it. Krugman notes that "on any given day, expectations determine the price," but what sets expectations? Expectations are set by the prevailing mood of traders, also known as the dominant market sentiment. No amount of infrastructure damage or shut-in oil was going to reverse the downward trend, unlike in 2005 when two powerful hurricanes caused a sudden spike in the price even though the amount of shut-in oil was about the same. A bullish sentiment ruled the market 3 years ago. Clive Maund's technical analysis tells us that oil is now oversold. Last summer, it was overbought. This follows from the psychology of groups. When the oil price is rising, and a bullish mood is established, it will invariably rise faster and higher than the fundamentals dictate. When it is falling, in a bearish mood, it will fall faster and lower than it should. Update—Yesterday (12/17/08) OPEC announced a 2.2 million barrel-per-day production cut. The oil markets reacted. Oil closed at $40.29, down $3.46 on the day. Today, oil has fallen further to $38.20/barrel. The attitude of the oil markets is conveniently attuned to their bearish mood as investors question whether the cuts will be effective. They're wondering whether OPEC can enforce this cut" because the budgets of many OPEC nations are already stretched incredibly thin, said Nimit Khamar, analyst with Sucden Financial in London. Will wonders never cease? The market assumes that demand is falling faster than OPEC can cut production. This behavior may be thought of as driven by an untreatable, unpredictable mood disorder affecting oil traders and markets generally. Along with self-deception, the "irrational exuberance" (or depression) that affects markets explains why bubbles form, ponzi schemes work and oil prices fall when OPEC announces huge supply cuts. On the bright side, the cuts are not yet reflected in inventories. Thus oil is treated like some inconsequential penny stock, not as a non-renewable resource which is the "lifeblood of the modern world." CERA's Peter Jackson estimates that project delays due to prolonged low oil prices could "curb future global fuel supplies by the equivalent of four million barrels a day within the next five years." As the oil markets set up the next price run-up, which will occur if and when the global economy recovers, we might expect the same kind of excessive volatility we've seen in 2008. Future oil prices will look nothing like those predicted by the Hotelling Rule. From Hamilton's conclusion— The $140/barrel price in the summer of 2008 and the $60/barrel in November of 2008 could not both be consistent with the same calculation of a scarcity rent warranted by long-term fundamentals. Notwithstanding, the algebra of compound growth suggests that if demand growth resumes in China and other countries at its previous rate, the date at which the scarcity rent will start to make an important contribution to the price, if not here already, cannot be far away. [emphasis added] Do you see the peak oil signal? comment and the rough least-squares line fit in Figure 2? There was time between 2002 and mid-2006 when the price appeared to be rising steadily in a Hotelling-like fashion. After an anomalous downturn in the 2nd half of 2006, the oil price started to conform again to the previous pattern in 2007. I was convinced then that scarcity rents were playing a role in oil pricing. I now recant. I no longer believe that story. That's not how oil gets priced. Here's one view of how future oil prices may play out. 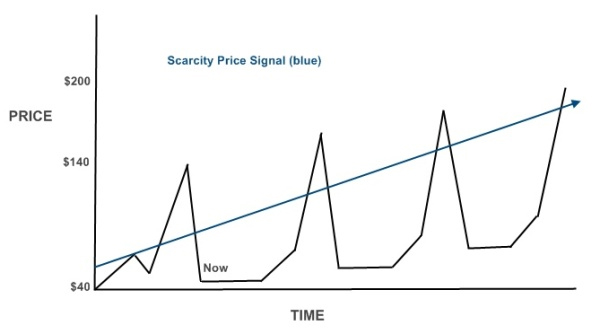 Figure 7 — Volatile future oil pricing, a crisis again and again
The pattern in Figure 7 displays some "real world" attributes of oil pricing and long-term fundamentals, to wit:
The first price spike (and decline) in Figure 7 was mostly caused by a global economic financial crisis which has been 20-odd years in the making. Very high oil prices were likely the straw that finally broke the camel's back. Subsequent spikes may be predominantly caused by the oil price itself and other assorted disasters like the inevitable crash of the dollar. Caveat Emptor! Figure 7 is not an attempt to predict future oil prices. It merely provides one plausible alternative to Hotelling. Future oil prices can not be forecast with any accuracy. Otherwise, I would be enjoying myself on my own private island. The issue discussed in this essay is whether the price does or does not tell us about Our Oil Future. It does not. We know the $45 oil price is not right as we look down the road to a time when the global economy rises like a Phoenix from the ashes. Because of the nature of oil pricing, I find it likely that we revisit the 2008 nightmare over and over again in future years. Contact the author at dave.aspo@gmail.com Notes 1. Equation (1) represents the general theory.
Equation (2) is the modified Hotelling Rule. The notation is by convention, see my Tragic Consequences for a more complete explanation with references, The Oil Drum, October 23, 2006, and Hamilton's commentary Is Peak Oil Irrelevant? on my article. 2. Taylor and Van Doren do not mention it, but they are defending the efficient market hypothesis. It is not hard to find an economist willing to tell us how the world supposedly works. Unlike Warren Buffett, Charles W. Smithson, author of Managing Financial Risk and the ABCs of Swaps and Other Derivatives in 2007, is quite sure about the reality of efficient markets. This is from Managing Financial Risk— However, we do not find this lack of success in forecasting exchange rates, interest rates, and commodities to be at all surprising. The markets for these financial prices are all markets that would characterized as efficient markets... There are times for a writer when words fail him. No level of sarcastic disbelief I could use here seems sufficient to the task at hand. Nonetheless, I will try, knowing I must fail. Here it is—
3. I can not entirely rule out a black swan event that would close the Strait of Hormuz, causing the oil price to spike to $100 or more. Still, I wonder at this point if anyone would notice if it did happen! 4. For example, Oil Speculation, It's Back describes how some people (with the means) are taking advantage of the carry-trade arbitrage opportunity created by the steep contango in the market by storing oil in rented tankers. Unlike futures flippers, contango traders really do impact oil prices, yet they're getting a free pass. According to the U.S. Energy Information Agency, domestic oil inventories have risen 9% since oil prices peaked in early July. While some of that is attributable to the weak economy and slack energy demand, gasoline consumption declined only 5% over the same period and gasoline inventories have risen only 4%. (If you're wondering why contango traders would target crude oil but not gasoline, vaporization issues make gasoline harder to store.) Contact the author at dave.aspo@gmail.com dave.aspo@gmail.comDecember 20, 2008 |
| Home :: Archives :: Contact |
TUESDAY EDITION June 9th, 2026 © 2026 321energy.com |
|