|
SUNDAY EDITION May 11th, 2025 |
|
Home :: Archives :: Contact |
|
|
The Oil Price Closely ObservedProfessor Ferdinand E. Banksferdinand.banks@telia.com July 1st, 2011 When recently asked why the (West Texas Intermediate) oil price at the end of June (2011) had declined from 112 dollars per barrel (=$112/b) to almost 90$/b in a fairly short time, I informed some visitors to the 2011 international meeting of the International Association for Energy Economics (IAEE, Stockholm) that it was probably because the OPEC directors were on their vacations instead of at their desks in Vienna, and as a result, when the oil price suddenly and unexpectedly moved below what I regard as its focal point, unadulterated market forces were able to take command, and the oil price was subjected to a palpable downward pressure. Focal point is an expression from game theory, and what it means in this context is a price that all producers can accept, that in an economic sense cannot be regarded as wholly unacceptable given external circumstances, and in these circumstances can function as an axis of coordination for a formal or informal strategy. For aesthetic reasons I usually call $100/b the present focal point, and in case you forgot, if this is the average oil price this year – for a melange of WTI and Brent prices – OPEC will collect a record one trillion dollars for its exports of crude oil. Not bad for an organization that the Nobel Laureate Professor Milton Friedman once predicted would soon be a historical oddment, and its precious oil would be selling for 5 dollars a barrel, or less. In my lecture at a privatization conference that was held the week before the IAEE meeting, I made it quite clear to colleagues that there is an ‘iron law’ of economics that is at least as important as Albert Einstein’s E = mc2. That law goes as follows: for the most part, people prefer more than less! I have used this law in my forthcoming energy economics textbook (2011) to explain why the proposed nuclear retreat in Germany will eventually turn out to be a meaningless economic gesture, and in another departure why OPEC countries are going to keep their output of crude oil as low as possible, regardless of what they might say and what their customers might desire. This does NOT however exclude OPEC from making some effort to recognize the macroeconomics trials and tribulations of the oil importing countries. After all, who would be so irrational as to jeopardize an expected income of a trillion dollars a year? In the lectures in my course on oil and gas economics at the Asian Institute of Technology (Bangkok), and to a lesser extent the main direction taken in my new and previous energy economics textbooks, I pinpoint (or zero-in) on some critical events in the intertemporal energy economics spectrum. (For example, for peak oil I explain in detail the circumstances associated with the peaking of oil production in the United States in l970, and for nuclear matters I concentrate on the construction of the Swedish nuclear sector.) I claim that the key to the oil price future can be found in the a diagram that I borrowed from one of the most important oil economists, David Cohen (2009). 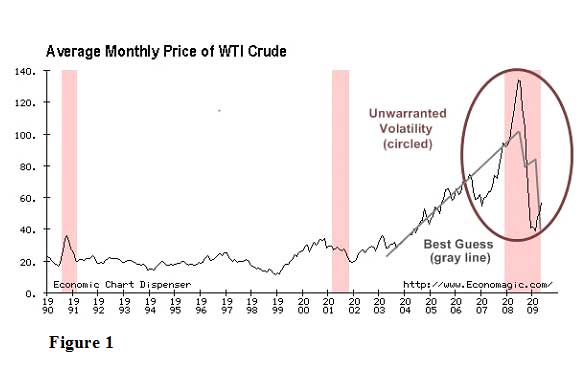
The thing that readers should be particularly careful to note is the sustained upward movement of the oil price after 2002-2003, because between those dates and 2008 something was taking place that probably had never been seen in the oil market in modern times. Readers should be even more aware that while the price of oil fell to about $32/b when the macroeconomic bad news intensified toward the end of 2008, and a number of distinguished students of the oil market announced that the oil price was going to continue to move down until it reached the point where they thought it belonged if the laws of supply and demand – the so-called fundamentals – became valid once more, OPEC quickly restored the situation in their favour. They restored the situation even though the international macroeconomy was moving into a partial meltdown. This point should never be forgotten, because it is a measure of the power of OPEC! One of the particularly controversial assertions I made in lectures in Paris and Bangkok a few years ago is that the most important occurrence in Figure 1 might have been the spike-like movement at the end of the previous century, when trend-wise the oil price was collapsing. With so-called energy experts in the major business publications predicting an OPEC shipwreck, the OPEC management switched into a scientific mode where their reasoning was concerned, and ascertained what solidarity and knowledge should accomplish when oil production was peaking in important producing regions like the North Sea, flattening elsewhere, and large discoveries of conventional reserves were NOT taking place. That told them and some of us what could happen very early in the new century. Then, in 2003-04, the escalating oil demand of China and India gave OPEC the opportunity they had always dreamed of, and they took advantage of it. What about speculation? In the diagram, in the background to the price movements from 1991 to the beginning of the new century, there was plenty of speculation, with smart speculators (who were usually called traders when they worked for investment banks) registering excellent incomes and bonuses; but from 2003 speculators – or traders as they are described on their visiting cards – did not have to be particularly smart. What they had to do to make serious money was to recognize that demand was outrunning supply, and one of the reasons for this is OPEC and its agenda becoming the determining factor on the supply side of the oil market, which is still the case! Unlike the situation when I published my oil book, the futures market for crude oil now occupies a significant role in the pricing of oil. I don’t pay as much attention to this as I did when I was teaching international finance, because to my present way of thinking if the actions of speculators or /traders or dealers in physical oil were not validated by fundamentals – i.e. supply and demand – a price movement of the steepness shown in the diagram could not possibly have taken place! Some algebra might be useful here, but it will be excluded because neither algebra nor anything else is acceptable nor desirable to the new chorus of hard-line populists who are resolutely determined to blame ‘Wall Street’ for the present macroeconomic meltdown, as well as the failure of the oil price to collapse as a result. REFERENCES Banks, Ferdinand E. (2011). Energy and Economic Theory. Singapore, London and New York: World Scientific (Forthcoming). ______ (2008)’The sum of many hopes and fears about the energy resources of the Middle East’. Lecture given at the Ecole Normale Superieure (Paris). _____.(2007). The Political Economy of World Energy: An Introductory Textbook. Singapore and New York: World Scientific. ______ .(1980). The Political Economy of Oil. Lexington and Toronto: D.C. Heath. Cohen, David (2009) ‘Mr Market gets it wrong again’. 321 Energy (May29). Constanty, H. (1995). ‘Nucleaire: le grand trouble’. L’Expansion (68-73). Bezat, Jean-Michel (2008). Petrole: le pouvoir a changé de camp. Le Monde (20, Mai) Hunt, Tam (2011). ‘The peak oil catastrophe in waiting’. Energy Pulse (03/10/11). Harlinger, Hildegard (1975). ‘Neue modelle für die zukunft der menshheit’ IFO Institut für Wirtschaftsforschung (Munich). Salameh, Mamdouh G. (2004). ‘Over a Barrel’. Beirut: Joseph D. Raidy. Saunders, Harry D. (1983). ‘Optimal oil producer behaviour considering macrofeedbacks’. The Energy Journal, Volume 4, Number 4. Professor Ferdinand E. Banks July 1st, 2011 ferdinand.banks@telia.com
|
| Home :: Archives :: Contact |
SUNDAY EDITION May 11th, 2025 © 2025 321energy.com |
|