BP-Sell-Signal despite Oil-Buy-Signal
By Makrocheck
December 19th, 2010
email: info@makrocheck.ch
http://en.makrocheck.ch/
.png) |
Since rising above the lower (green) upward-trend-channel at approx. $38 in September 2010, a longer-term buy-signal predominates again for the BP stock at the NYSE.
However, a sell-signal was just issued with reaching the (red-grey-green) intersection-resistance at $45. Next distinct buy-signal when rising above it, or in case of a further correction to the (green) upward-trend-channel currently at approx. $38 (longer-term sell-signal when breaching this support). |
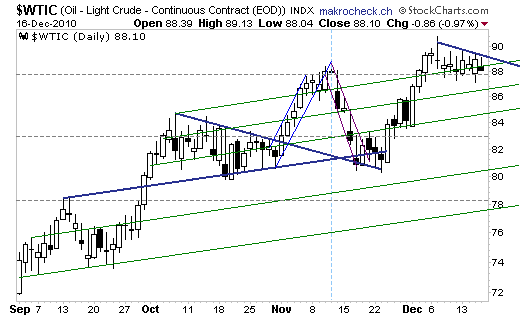 |
At the same time, we are still bullish on the oil price, especially since the (grey-dashed) horizontal-resistance at approx. $88 was broken in early December that was marked by the breakout out of the (blue) triangle.
Generally, the minimum goal of a thrust to the upside out of a triangle is to break & transform the high that was marked (by the triangle and/or its breakout) into a new & sustainable support so that a new & sustainable upward-trend can commence.
Thus, a continuation of the strong price appreciation since November 2010 is expected soon, especially when rising above the (blue) resistance currently at approx. $88.50. |
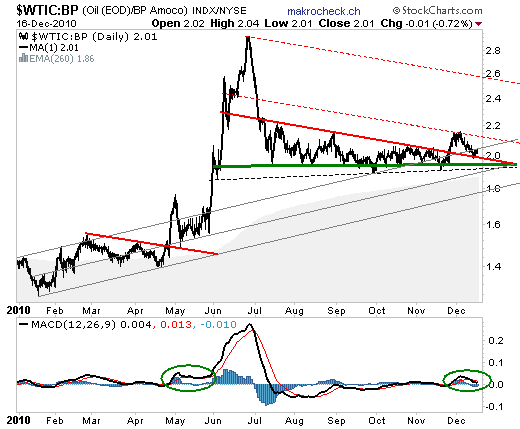 |
A buy-signal for the oil price & a sell-signal for the BP-stock represent the expectation of a rising Oil-BP-Ratio.
And indeed, the ratio currently indicates a strong increase ą la thrust to the upside out of the (red-green) triangle as a breakout above the (red) triangle-leg at 2 points was accomplished in the end of November & as well a pullback to this former strong resistance was completed recently – hence, the thrust can have started already (yet numerous pullbacks can occur before a thrust begins).
Further, it is noted that the ratio can increase strongly as well when both the oil price & the stock price of BP rise (in which case the oil price just increases correspondingly stronger as the stock of BP) as a ratio solely represents a relative (performance) comparison.
As soon as the (green) triangle-leg is breached, a thrust to the downside is anticipated in which case an investment in BP is to be favorized when compared to oil.
|
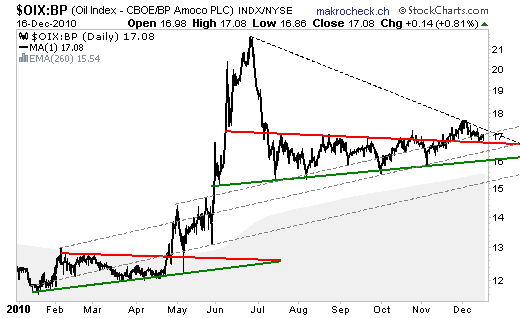 |
A similar picture is given by the OIX-BP-Ratio that achieved a breakout above the (red) triangle-leg as well in November indicating a thrust to the upside now after the successfully completed pullback.
A more distinct buy-signal for the ratio (i.e. for OIX against BP) is issued when rising above the (black-dashed) resistance.
A thrust to the upside signifies that the oil- & gas-stock-index OIX achieves a better performance than the stock of BP which means that other oil- & gas-stock are recommended to be considered.
Not only the stock of BP, but as well 6 other stocks are constantly analyzed (at the end of each month) within the oil- & gas-section of the following site: http://en.makrocheck.ch/216-Oel-amp-Gas
An access free of charge & obligation can be applied for here: http://en.makrocheck.ch/login.php?status=1 |
By Makrocheck
December 19th
email: info@makrocheck.ch
http://en.makrocheck.ch/