|
SATURDAY EDITION February 7th, 2026 |
|
Home :: Archives :: Contact |
 |
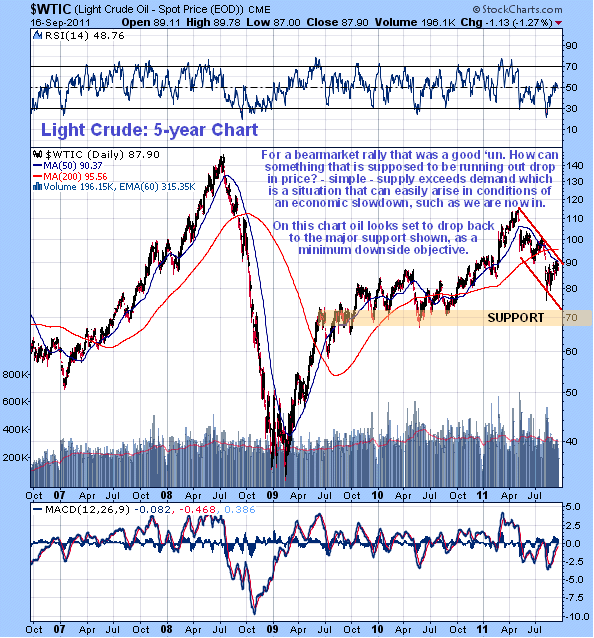
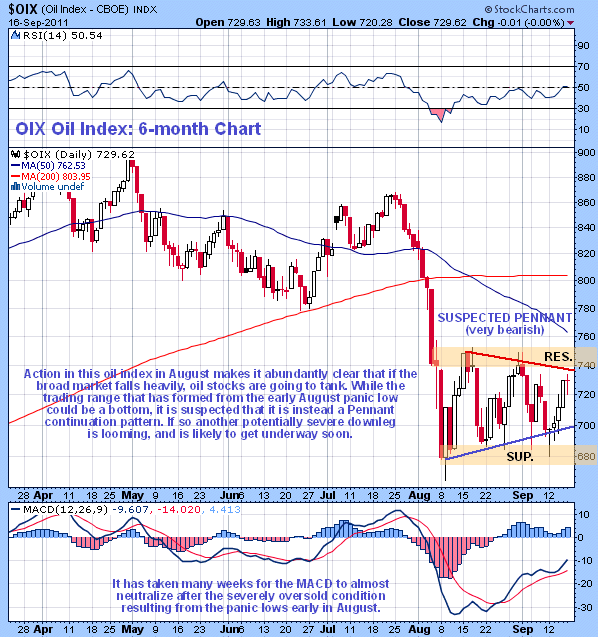
Oil Market UpdateClive Maund support@clivemaund.com September 20th, 2011 We have scarcely looked at oil in recent months, as, apart from 2 short-lived tradable plunges, it has been very difficult to make money in this market - gold has been far more interesting. Yet this is remiss because oil is clearly of massive economic and political significance, immensely greater than gold, so it is always worth keeping an eye on what it is doing. On its 7-month chart we can see that Light Crude went into reverse and began a downtrend that kicked off with a plunge early in May. This plunge synchronized with a sharp drop in commodities generally, especially silver which you may recall took a particularly severe beating. The downtrend continues and shows no signs of abating. To date there have been 3 significant downlegs within this downtrend, that have been followed by first a Trianglular consolidation, then a bearish Falling Wedge in July, and then another Falling Wedge which is right now completing - implying that another downleg is just about to start. Signs that the latest Wedge is complete are the fact that it has brought the price up to a zone of resistance that arises from earlier trading, which is just below its falling 50-day moving average and also close to the major downtrend channel line, with the countertrend movement of the price as it has advanced within the Wedge serving to largely neutralize the deeply oversold condition that resulted from the early August plunge. The continuing downtrend of the past several months has also resulted in a bearish cross of the moving averages, and while the 200-day moving average is still rising, which could theoretically result in a reversal, the formation of a bearish Wedge in recent weeks points to another downleg, as already mentioned that should turn the 200-day m.a. down.


 Clive Maund September 20th, 2011 support@clivemaund.com Clive Maund is an English technical analyst, holding a diploma from the Society of Technical Analysts, Cambridge and lives in The Lake District, Chile. Visit his subscription website at clivemaund.com .[You can subscribe here]. Clivemaund.com is dedicated to serious investors and traders in the precious metals and energy sectors. I offer my no nonsense, premium analysis to subscribers. Our project is 100% subscriber supported. We take no advertising or incentives from the companies we cover. If you are serious about making some real profits, this site is for you! Happy trading. No responsibility can be accepted for losses that may result as a consequence of trading on the basis of this analysis. Copyright © 2003-2011 CliveMaund. All Rights Reserved. |
| Home :: Archives :: Contact |
SATURDAY EDITION February 7th, 2026 © 2026 321energy.com |
|