Oil Market Update - overbought but ultimately headed much higher...
Clive Maund
January 20th, 2022
Oil prices are not rising because of increasing global demand, they are rising because of the exponential growth of fiat, severe supply chain issues and in the recent past because of rising geopolitical tensions that are orchestrated, and with these factors set to intensify there doesn't seem to any end in sight to the rise in the price of oil and various other commodities.
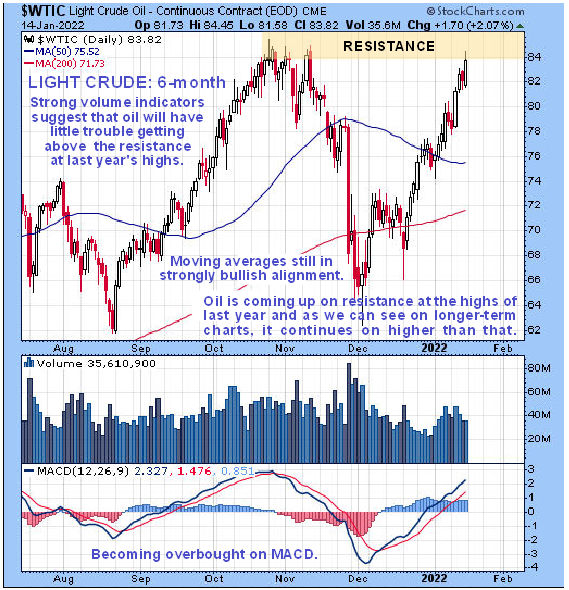
On the latest 6-month chart for light crude we can see that afer a sharp drop late in November, a Double bottom-like base has been followed by renewed advance that has brought it back up to resistance in the vicinity of its late October - early November highs. Moving averages are in strongly bullish alignment and while it getting quite heavily overbought on its MACD indicator, it could run further before this move is done.
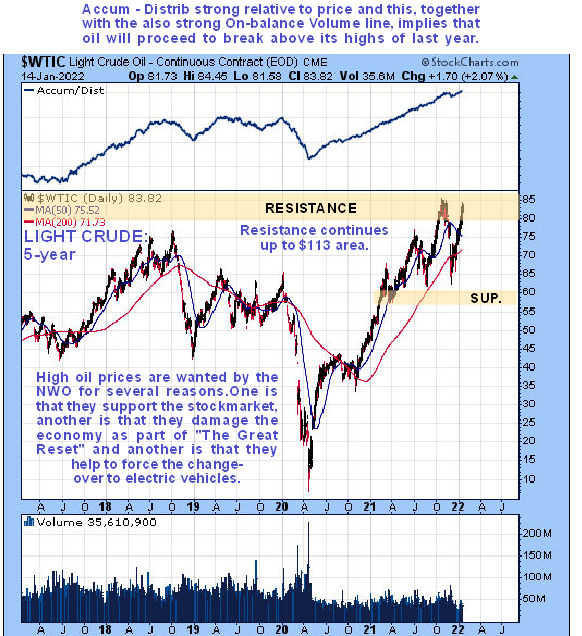
Despite being overbought and at resistance at its Oct - Nov highs, oil could continue to advance for the reasons mentioned above and we know that Big Money benefits from high oil prices which support the stockmarket and assist the flow of wealth up to the top of the pyramid. They also assist the push to phase out petrol driven vehicles in favor of electric vehicles, and to the extent that they damage the economy, this is regarded as a good thing by those in control as this will assist The Great Reset. On the 5-year chart we see that the Accumulation line is strong relative to price, as is the On-balance Volume line (not shown) which increaes the chances that oil will continue to advance, perhaps after pausing to consolidate.
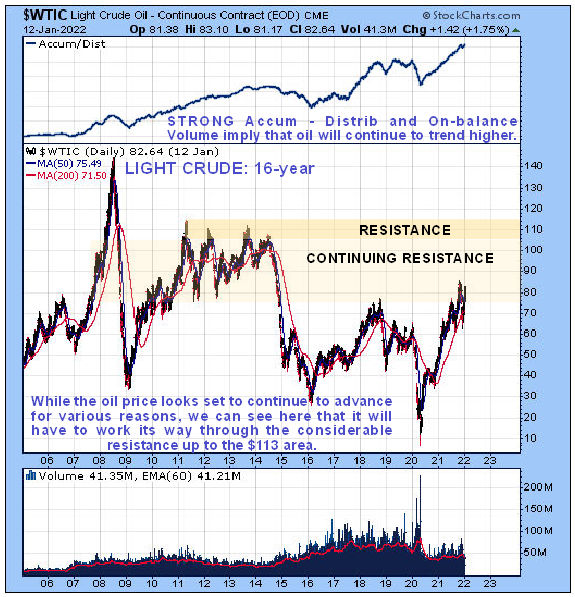
The 16-year chart is useful as it puts the action of recent years into perspective. On this chart we see that the oil price still has quite a lot of resistance to plough through all the way up to the line of peaks in the $110 - $115 zone, which we can in any event regard as a target once it gets there, even if it is destined to continue on to much higher levels later. Here it is worth noting that resistance in something like oil especially when going back years does not function in exactly the same way as it does with say stocks, where you have "bagholders" hanging around sometimes for years waiting for a chance to get out even.
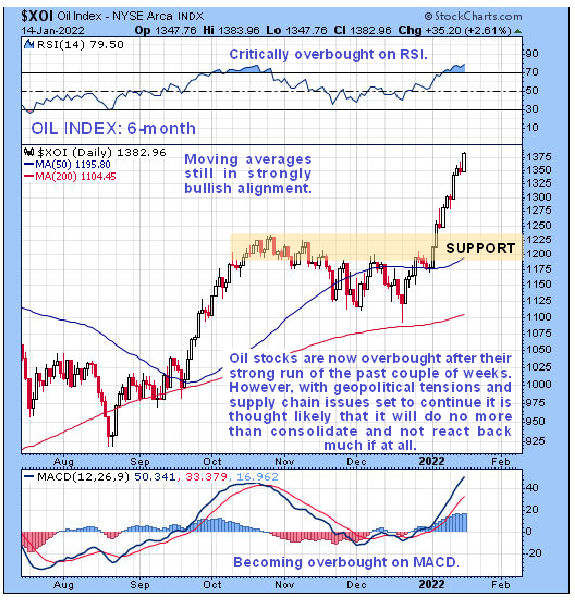
With respect to oil stocks we can see on the 6-month chart for the oil index that they have had a really strong run in recent weeks that has resulted in this index now being critically overbought on its RSI indicator and quite heavily overbought on its MACD. This makes it likely that it will pause to consolidate soon and while it could react back, it is considered unlikely that it will react back much because of the various factors mentioned above. This is clearly an established bullmarket with the larger uptrend very much in force and moving averages in strongly bullish alignment.
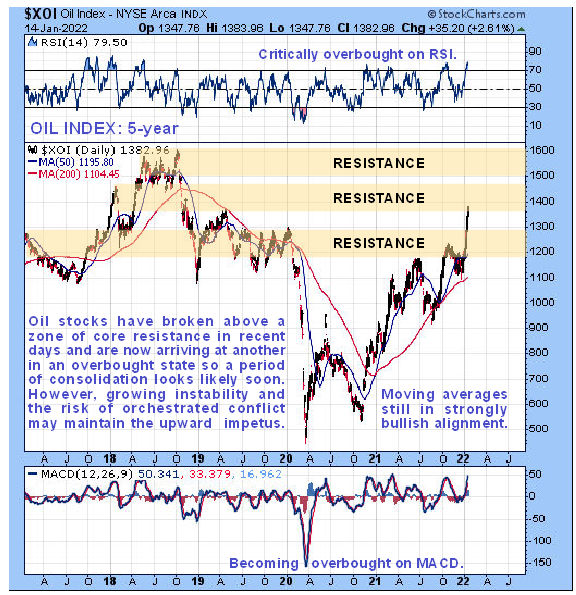
On the 5-year chart for the XOI index we can see that it had been rounding over during most of 2021 due to the weight of overhead resistance arising from the large trading range that formed during 2019, but in recent weeks it has broken through that and is now arriving at another broad zone of resistance and while it could continue higher still before it stops, it is getting very overbought which makes a pause to consolidate a growing probability.
End of update.
Clive Maund
January 20th, 2022
support@clivemaund.com
Clive
Maund is an English technical analyst, holding a diploma from
the Society of Technical Analysts, Cambridge and lives in The Lake District, Chile.
Visit his subscription website at
clivemaund.com .[You can subscribe
here].
Clivemaund.com is dedicated to serious investors and traders in the precious metals and energy sectors. I offer my no nonsense, premium analysis to subscribers. Our project is 100% subscriber supported. We take no advertising or incentives from the companies we cover. If you are serious about making some real profits, this site is for you! Happy trading.
No responsibility can be accepted for losses that may result
as a consequence of trading on the basis of this analysis.
Copyright
© 2003-2026 CliveMaund. All Rights Reserved.


