ChartWorks
PUBLISHED BY INSTITUTIONAL ADVISORS
WEDNESDAY, AUGUST 27, 2008
Technical observations of
RossClark@shaw.ca
Natural Gas and XNG
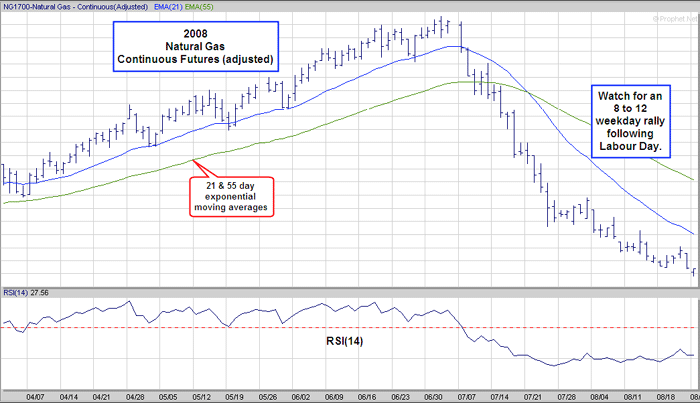
Many commodities and related stocks have strong seasonal characteristics. When they fail to react
normally around such periods the anomaly can be even more helpful in the ongoing analysis. In the
case of the Natural Gas price there are typically two rallies; February trough April and August through
October. When the August rally is delayed the next best window for a bottom has been around the
Labour Day weekend. Once prices turn higher starting September 2nd, then
look for the rally to last a
minimum of eight to 12 trading days. The bullish divergence in the related stocks suggests that
the rally could last through October.
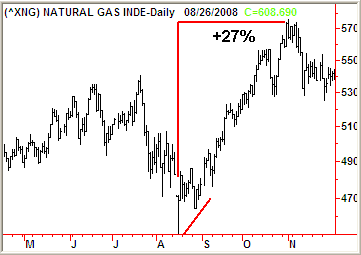
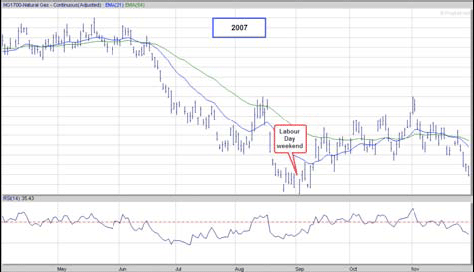
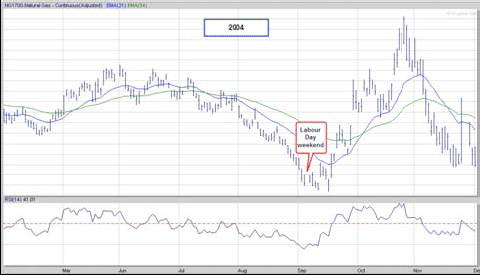
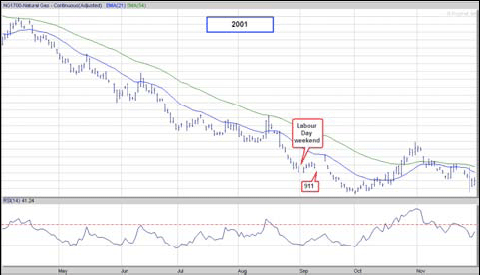
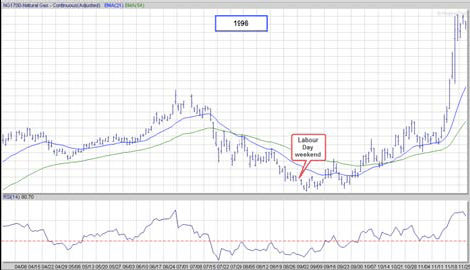
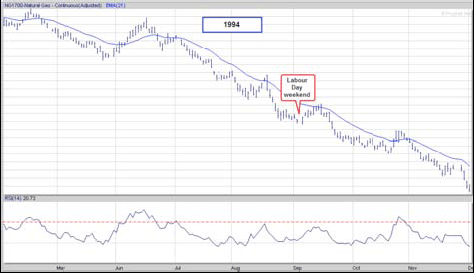
The following charts of futures contracts, adjusting for the monthly rollover, display April 1st through
December 1st of the years that declined to new lows in the second half of August (2007, ’04, ’01, ’98,
’96 & ’94).
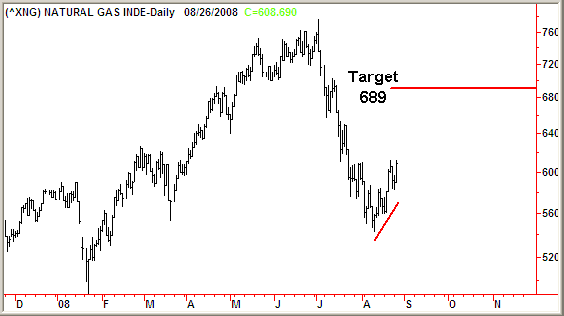
Currently there is a distinct bullish divergence between the price of the commodity and the associated
stocks as represented by the XNG. The three years that exhibited such characteristics in the second
half of August were 2007, 2004 and 1996. In each instance the XNG rallied well through October and
was up by 26% through the end of November.
The upside target for this year becomes 689. Any
pause in the current rally would be considered a buying opportunity. A violation of the 560 support
would be considered to be outside the bullish pattern and warrant a liquidation of trading positions.
 Years with bullish divergences in August
2007
 2004
2004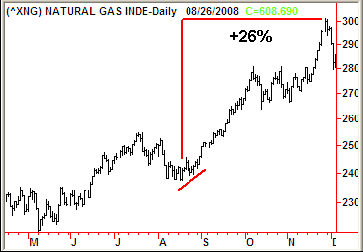 1996
1996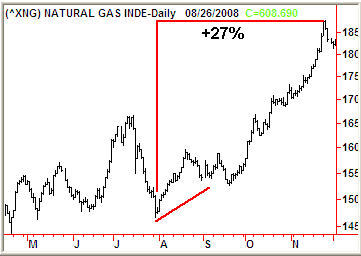
currency rates of exchange may adversely affect the value, price or income of any security or related investment mentioned in this report. In addition, investors in securities such as ADRs, whose values are influenced by the currency of the underlying security, effectively assume currency risk.
Moreover, from time to time, members of the Institutional Advisors team may be long or short positions discussed in our publications.
BOB HOYE, INSTITUTIONAL ADVISORS
EMAIL::
bobhoye@institutionaladvisors.com
CHARTWORKS WEBSITE::
www.institutionaladvisors.com



 2004
2004 1996
1996