|
TUESDAY EDITION April 23rd, 2024 |
|
Home :: Archives :: Contact |
|
|
Are Oil Prices Ready to Break out of the Trough?By Frank Holmes In ancient Greek mythology, the Titan Atlas was charged with holding up the world. Today, that task largely falls on the shoulders of American businesses. For the month of November, the Manufacturing Institute for Supply Management (ISM) reading was 58.7, marking the 18th consecutive month of manufacturing expansion in the U.S. Anything above 50.0 denotes growth, anything below, contraction. Among the areas that showed particularly strong growth were new orders and exports. But while the U.S. continues to expand, the rest of the world cools or, at best, remains in a holding pattern. The J.P.Morgan Global Manufacturing Purchasing Manager’s Index (PMI), released Monday, registered a 14-month low of 51.8. Had the U.S.’s individual score not been as strong, the global PMI number might not have exceeded the expansion threshold. 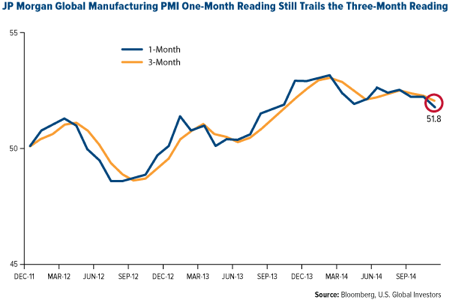
The eurozone and China were the largest drags on global manufacturing. Whereas Europe registered a 50.1 for November—even usually dependable Germany scored a 17-month low of 49.5—China remained flat with a 50.0, the country’s lowest reading since May. You might wonder how this relates to oil prices. The answer: Quite a lot, actually. Just as the U.S. is the standout in manufacturing growth, it's also now the world leader in oil production, thanks largely to hydraulic fracturing. The two combined—global slowdown and abundant oil—have prompted the rapid decline in prices. Slow Global Manufacturing Growth Contributes to Slump in Oil Prices Not only is the global PMI at a 14-month low, but it also marks the fourth-consecutive month that the one-month reading has stayed below the three-month. Regular readers might recall seeing the following chart, which helps explain why oil prices are so depressed: 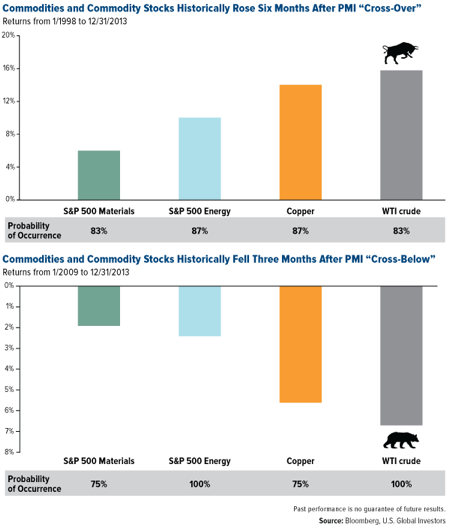
When global manufacturing has slowed in the past, so too has oil demand, driving prices down 7 percent 100 percent of the time. Today, crude has fallen much more steeply than that—35 percent since June—but other factors have contributed to the recent slump, from the The chart also shows that when manufacturing activity has ramped up, prices have jumped over 16 percent 100 percent of the time three months later. Oil in Oversold Territory So short of an unexpected jumpstart to global manufacturing, how else might oil break out of its trough? “The theme going into 2015 is mean reversion,” says Brain Hicks, portfolio manager of our Global Resources Fund (PSPFX). “Oil prices are below where they should be, and hopefully they’ll start gravitating back to the equilibrium price of between $80 and $85 a barrel.” Crude oil is currently down 1.2 standard deviations for the 10-year period. This might not sound like much, but as you can see, oil has rarely gone above or below one standard deviation during this time. Plus, its wild volatility during the financial crisis rejiggered the commodity’s mean. 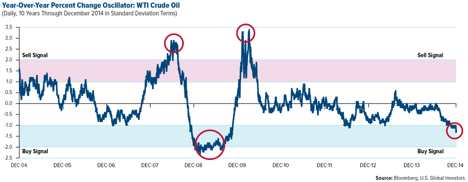
What the oscillator above also shows is that oil has eventually returned to where it should be, as it did not only after the financial crisis but also in the third quarters of 2011 and 2012. Barron’s pointed out in a piece published this week that “prior price slides lasted roughly 20 weeks. The current slide is already at week 24. History suggests the panic… is near its end.” Indeed, oil markets have historically been quick to recover because exploration and production become unsustainable otherwise. Several shale regions in Texas were already And that’s just in the U.S. Many countries whose economies rely on oil exports, including Russia, Venezuela and Nigeria, will be unable to balance their budgets with $65-per-barrel oil. Though not yet underwater, Saudi Arabia might soon begin to feel the pinch, as Brent is getting treacherously close to the Kingdom’s breakeven price, which has risen about $10 per barrel in only five years. 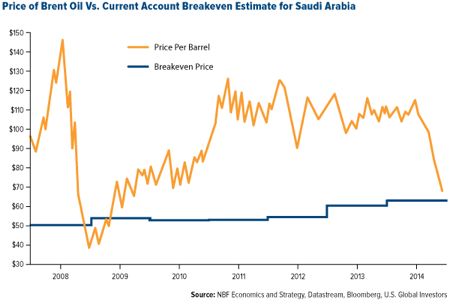
At the same time, many of Saudi Arabia’s traditional vertical wells can continue to operate at less than $10 per barrel. A production cut, then, is not as imperative to the Kingdom’s budget as it is to Russia’s or Venezuela’s. However, Prince Turki bin Faisal, former Saudi ambassador to the United States, stated on Tuesday that Saudi Arabia would agree to cuts only if other countries, including non-Organization of the Petroleum Exporting Countries (OPEC), participated. This indicates that, while the Kingdom doesn’t want to lose market share, it realizes action must be taken to prop up prices. And herein lies the opportunity. “Oil is way oversold right now on a relative strength basis,” Brian says. With the commodity at a five-year low, oil stocks are on sale, just in time for holiday shopping. By Frank Holmes Frank Holmes is CEO and chief investment officer of U.S. Global Investors, Inc., a boutique investment advisory firm based in San Antonio that manages domestic and offshore funds specializing in the natural resources and emerging markets sectors. The company’s no-load mutual funds include the Global Resources Fund (ticker PSPFX), which invests primarily in energy-related stocks. For more insights and perspectives from Frank Holmes, visit his investment blog “Frank Talk” at http://www.usfunds.com/investor-resources/frank-talk/.
U.S. Global Investors, Inc. is an investment management firm specializing in gold, natural resources, emerging markets and global infrastructure opportunities around the world. The company, headquartered in San Antonio, Texas, manages 13 no-load mutual funds in the U.S. Global Investors fund family, as well as funds for international clients.
|
| Home :: Archives :: Contact |
TUESDAY EDITION April 23rd, 2024 © 2024 321energy.com |
|