The Many Factors Fueling a Return to $100 Oil
By Frank Holmes
CEO and Chief Investment Officer
U.S. Global Investors
http://www.usfunds.com/
rgeorge@usfunds.com
November 15th, 2011
Oil prices rose about 5 percent last week to finish only a dollar short of regaining triple-digit status. Since dipping below $80 per barrel on October 3, West Texas Intermediate (WTI) prices have increased almost 28 percent. This increase is nearly twice that of the S&P 500 Index, up 15 percent since October 3, but reinforces a recent trend for oil prices-as equities go, so goes oil.
This chart put together by the U.S. Energy Information Administration (EIA), illustrates how WTI crude oil prices and equities have moved nearly in tandem over the past few months.
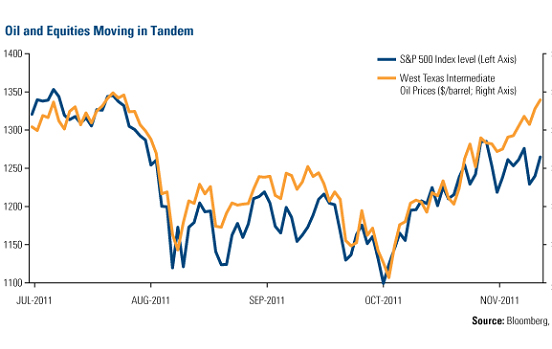
The EIA says "the recent strong relationship between oil and equity prices resembles that seen during the economic downturn and recovery in 2008-2010." According to EIA data, crude oil and the S&P 500 Index have had a positive correlation in 12 of the past 13 quarters. A positive correlation had not occurred once in the previous 35 quarters. In fact, crude oil and equities experienced a negative correlation during five quarters over that time period.
This recent strong correlation implies that equities have the potential to move higher if oil prices continue along their current trajectory. Given oil's current supply/demand fundamentals, there's a good chance of that happening.
Demand Holds Strong Despite Global Uncertainty
One of the key drivers for rising oil prices is demand, which has held steady despite the turmoil in Europe, sluggish economic growth in the United States and a slowdown in China. In fact, Citigroup says there is "no indication of a demand collapse unfolding as in 2008."
While year-over-year comparisons show global demand growth is slowing, Citigroup points out that this year's data compares with a 2010 period propped up by government policies encouraging consumption, such as the Fed's QE2 program. Citigroup says these comparisons are "obscuring the fact that demand continues to grow and, barring a sharp derailment of the global economy, is on course to make a record high in 4Q11 and on an annual basis in 2012."
By the end of 2012, the EIA forecasts world crude oil and liquid fuel consumption will total nearly 90 million barrels per day. This chart from PIRA carries the demand curve further into the future, forecasting demand to surpass 110 million barrels per day by 2025.
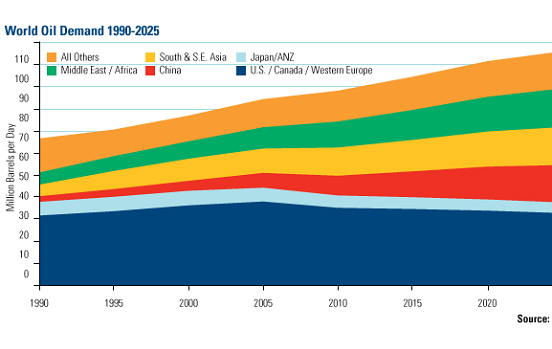
What is driving this increase? The emerging market transportation sector.
In its World Energy Outlook released last week, the Paris-based International Energy Agency (IEA) says crude oil consumption will be driven by developing countries over the next 20 years. These countries will account for 90 percent of the world's population growth, 70 percent of the increase in economic output and 90 percent of global energy demand growth over the period from 2010 to 2035.
The agency predicts global crude oil demand will rise to 99 million barrels per day by 2035 "as the total number of passenger cars doubles to almost 1.7 billion in 2035." If this prediction holds true, it means that there will roughly be as many cars in the world as there were people 100 years ago.
Long-term, Short-term Constraints Threaten Supply
WTI prices have remained in backwardation since shifting from three years of contango in late October. Contango means that the price of commodity contracts expiring in the near term is lower than the forward, future price of crude contracts. Backwardation is the opposite: The price of a commodity today is higher than the future purchase price.
While everyday investors may get tripped up by the contango/backwardation jargon of oil markets, the most important thing to recognize is that this significant shift signals there are short-term constraints in supply pushing prices higher. In fact, crude oil inventories in the United States are now at the lowest seasonal level in seven years, according to Bank of America Merrill Lynch. When the shift occurred, BofA analysts wrote this "is a major development for the crude oil market" and "signals $105 oil."
Backwardation is a short-term signal; a long-term signal is the growing amount of geopolitical unrest bubbling up to the surface in the world's largest oil-producing region.
Last week, the International Atomic Energy Agency (IAEA) released a detailed report that verified many suspicions of nuclear proliferation in Iran. The IAEA noted it was concerned about Iran's "activities related to the development of a nuclear payload for a missile."
This news does not sit well with others in the region, such as Israel, who have threatened military action should the country deem Iran a security threat. A research note from Barclays articulates the combustible situation with a quote from Amos Harel and Avi Issacharoff, writers for Haaretz: "A few more weeks of tension and one party or another might make a fatal mistake and drag the region into war."
War and/or unrest in the region have the potential to have a tremendous effect on oil prices because of its proximity to the majority of global oil production. PIRA says that the Middle East accounts for over 70 percent of OPEC oil production and account for over 95 percent of the cartel's capacity growth along with North Africa.
It's not only production that is threatened. One of the largest chokepoints along the global oil supply chain is the Strait of Hormuz, which roughly 90 percent of all Persian Gulf oil tankers-some 18 million barrels per day-pass through, according to Barclays. With Iran controlling the entire northern border of the strait, there is a significant chance for disruptions should the country fall into conflict or war.
This is just one example of oil's geopolitical DNA. With more than 40 percent of the world's oil controlled under autocratic rule, oil supply in democratic nations likely depends on the state of autocratic nations.
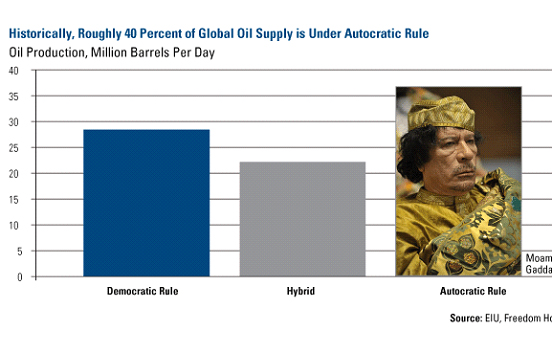
Following the death of Moammar Gaddafi, the Washington Post reports that oil companies are eager to begin pumping oil in Libya again but the new regime is still battling Gaddafi supporters and the country is a long way from being unified. Barclays notes several concerns: oil fields need to be repaired, Interim Transitional National Council has experienced growing factions, and there's been a proliferation of weapons.
There's also sanctions and persistent violence in Syria. In Yemen, an oil export pipeline was blown up a couple of weeks ago, making it the fifth attack in just a month. Barclays indicated that "almost half of Yemen's 260,000 barrels per day of oil output has been offline since March" and it doesn't look like the situation will improve any time in the near future.
Trends in Demand and Supply Maintain Pressure on Prices
While BofA analysts think that oil prices could be headed toward $105 per barrel in the short term, the IEA offered a longer-term view that should give natural resources investors calm for many years to come.
The IEA says "trends on both the oil demand and supply sides maintain pressure on prices. We assume the average IEA crude oil import price remains high, approaching $120 per barrel (in 2010 dollars) in 2035 (over $210 per barrel in nominal terms)."
That's a distant projection but it certainly illustrates why you should consider investing a portion of your wealth in oil.
By Frank Holmes
CEO and Chief Investment Officer
U.S. Global Investors
http://www.usfunds.com/
rgeorge@usfunds.com
November 15th, 2011
Frank Holmes is CEO and chief investment officer of U.S. Global Investors, Inc., a boutique investment advisory firm based in San Antonio that manages domestic and offshore funds specializing in the natural resources and emerging markets sectors. The company’s no-load mutual funds include the Global Resources Fund (ticker PSPFX), which invests primarily in energy-related stocks.
For more insights and perspectives from Frank Holmes, visit his investment blog “Frank Talk” at http://www.usfunds.com/investor-resources/frank-talk/.
U.S. Global Investors, Inc. is an investment management firm specializing in gold, natural resources, emerging markets and global infrastructure opportunities around the world. The company, headquartered in San Antonio, Texas, manages 13 no-load mutual funds in the U.S. Global Investors fund family, as well as funds for international clients.
Please consider carefully a fund's investment objectives, risks, charges and expenses. For this and other important information, obtain a fund prospectus by visiting www.usfunds.com or by calling 1-800-US-FUNDS (1-800-873-8637). Read it carefully before investing. Distributed by U.S. Global Brokerage, Inc.
Foreign and emerging market investing involves special risks such as currency fluctuation and less public disclosure, as well as economic and political risk. Because the Global Resources Fund concentrates its investments in a specific industry, the fund may be subject to greater risks and fluctuations than a portfolio representing a broader range of industries.
All opinions expressed and data provided are subject to change without notice. Some of these opinions may not be appropriate to every investor. The S&P 500 Stock Index is a widely recognized capitalization-weighted index of 500 common stock prices in U.S. companies. Standard and Poor's 500 Energy Equipment & Services Index is a capitalization- weighted index. The parent index is SPXL3. The index was developed with a base value of 100 as of 30 December, 1994. This is a GICS Level 3 Industries.