|
THURSDAY EDITION February 19th, 2026 |
|
Home :: Archives :: Contact |
 |
Oil Market updateClive Maund August 8th, 2005
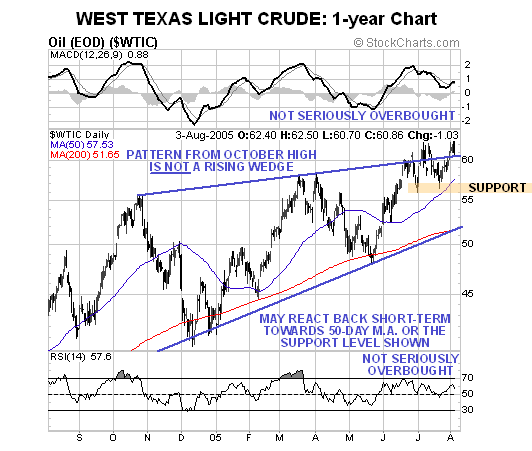
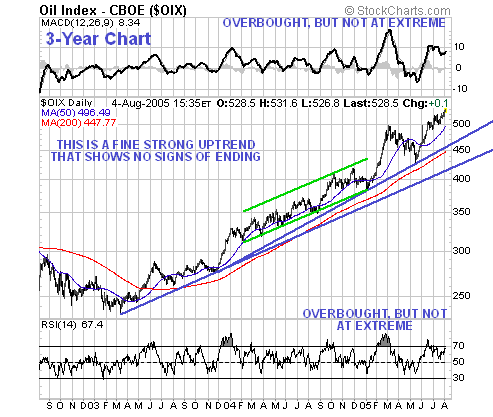
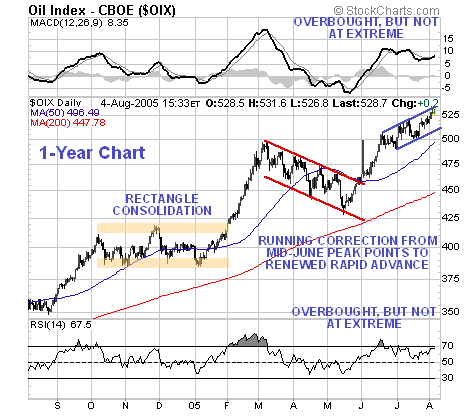
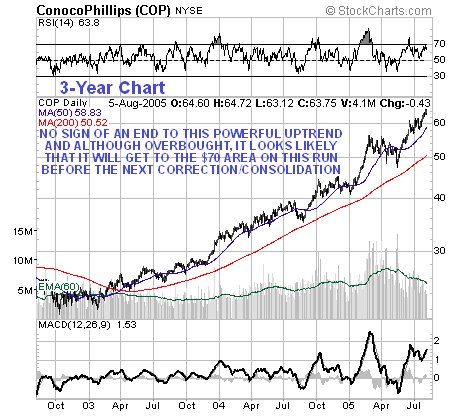
In this update we will start by standing back and taking a look at the big picture, for it is not so easy to determine the outlook this time round by looking at the shorter-term chart. For this purpose we will use a 3-year chart. This chart shows the oil bull market from its inception.  On this chart we see that, despite cyclical corrections along the way, oil has been in a steady uptrend from the start of 2004, as indicated by the relentless rise in the 200-day moving average. Notice how the price has, for the most part, found support on corrections in the vicinity of the 200-day moving average, only dipping significantly beneath it when it became deeply oversold last December. Turning now to the 1-year chart to view recent action in more detail, we see that at first sight the market looks overbought relative to its moving averages and appears to be topping out on an intermediate basis, as it did last October and again in March-April. This time, however, it looks different. In the first place, it is nowhere near so overbought relative to its moving averages as it was on those two previous occasions, and the choppy sideways of the past 6 weeks, while admittedly a potential intermediate top, has allowed the overbought condition that had developed by mid-June to ease. Another very important point to observe is that the pattern from last October’s high IS NOT a bearish rising wedge, on the contrary, the fact that the price succeeded in pushing above the restraining top trendline points to future acceleration, acceleration from here, in fact.  In conclusion, while the market may react back some short-term from the resistance at about $62 towards the 50-day moving average, following the rather sharp advance of the past couple of weeks, and possibly retreat further towards the support level at about $56.50, it nevertheless looks well placed to accelerate higher from here, and confound the many who are expecting a routine correction back towards the 200-day moving average. This fits with the outlook for the precious metals, following the powerful breakout by the gold stock indices on Wednesday. The charts for the oil stocks themselves are considerably easier to interpret. Starting with the 3-year chart for the OIX oil index, whose time period has been selected partly to allow for direct comparison with the oil price itself, it is obvious even to a half-wit that this market is in a fine, steady uptrend, that as yet shows no sign of ending. This uptrend is so vigorous that corrections are not even running back to the 200-day moving average, before the market resumes its advance.  Turning to the 1-year chart to examine recent action in more detail, we see that index staged a strong advance from mid-May to mid-June, to become overbought, but interestingly this was not followed by a period of reaction or a period of consolidation, but rather by a creeping advance that has allowed the overbought condition to unwind somewhat even as the market has continued to move ahead. This type of time correction is known as a “running correction” and is bullish, as it indicates a market that is so strong that it doesn’t really want to correct at all, and can be said to do so only grudgingly. What this points to is acceleration, which of course fits with our scenario for oil itself, and as demonstrated by the MACD and RSI indicators at the top and bottom of the chart, although the market is overbought, it is not yet at an overbought extreme, and if it were to match, or exceed, the overbought condition that developed last March, it would mean a rise to considerably higher levels from here.  Thus it looks as though, despite being technically overbought, both oil and oil shares are set to run to significantly higher levels before the current intermediate uptrend exhausts itself. We’ll finish with a brief look at Conoco Phillips, the major oil stock that we have been following in these updates, and which was substituted for Exxon Mobil, as it is stronger. On this occasion we’ll look at a 3-year chart to gain a broader perspective. On this chart we can readily see the strong uptrend that shows no signs of ending, and how this uptrend is riding above the 200-day moving average, with even the deepest corrections not taking the price right back to this average. It is clear that this stock is substantially overbought, but, given that that oil and the oil stock indices are expected to push still higher over the short to medium-term, it is considered likely that it will run further to the $70 area before a correction or period of consolidation sets in. 
Clive Maund |
| Home :: Archives :: Contact |
THURSDAY EDITION February 19th, 2026 © 2026 321energy.com |
|